Embargoed Until 12:01am, October 5, 2017 | October 5, 2017
Contact:
Jill Braunstein at (202) 452-8097
WASHINGTON, D.C. – Total workers’ compensation benefits paid increased in Washington State between 2011 and 2015, but spending on medical benefits declined, according to a new report from the National Academy of Social Insurance (the Academy).
In 2015, total workers’ compensation benefits paid in Washington were $2.4 billion. Between 2011 and 2015, total benefits paid increased 3.8 percent in the state, compared to a 0.7 percent increase in the rest of the U.S. over the same period. The increase in total benefits in Washington was driven by a 6.6 percent increase in cash benefits paid, but the growth rate in total benefits was moderated by reductions in medical spending.
Total medical benefits fell to $734 million in 2015, a 2.2 percent decrease from 2011. Medical benefits as a share of total benefits fell from 32.4 percent in 2011 to 30.5 percent in 2015. Compared to the rest of the nation, Washington had the second lowest percentage share of medical benefits relative to total benefits paid in 2015.
“Washington experienced significant growth in employment covered by workers’ compensation, so it is not surprising that total benefits paid increased faster than in the rest of the nation,” said Christopher McLaren, Senior Researcher at the Academy and lead author of the report. “However, what stands out about Washington is that its total spending on medical care has continued to gradually decline, and it has consistently had one of the lowest shares of medical benefits relative to total benefits paid across the country in recent years.”
In 2015, workers’ compensation costs in Washington were $2.8 billion. Between 2011 and 2015, costs increased 14.6 percent, lower than the percent increase in the rest of the U.S. (20.9 percent). In Washington, workers contribute directly to the insurance premiums for workers’ compensation. In 2015, about 22 percent of the total costs of workers’ compensation were paid by workers.
Table 1. Workers’ Compensation Benefits, Coverage, and Costs: Washington and the Rest of the U.S.
|
2015 |
Percent Change 2011 to 2015 |
|||
|
WA |
Rest of U.S. |
WA |
Rest of U.S. |
|
| Aggregate Benefits, Coverage, and Costs | ||||
| Total Benefits (billions) |
$2.4 |
$55.8 |
3.8% |
0.7% |
|
Medical Benefits |
$0.7 |
$29.2 |
-2.2% |
0.8% |
|
Cash Benefits |
$1.7 |
$26.6 |
6.6% |
0.7% |
| Covered Workers (thousands) |
3,049 |
129,788 |
9.9% |
7.9% |
| Covered Payroll (billions) |
$172 |
$6,802 |
24.4% |
19.1% |
| Total Costs (billions) |
$2.8 |
$87.1 |
14.6% |
20.9% |
|
Employer Costs |
$2.2 |
|
13.1% |
|
|
Employee Costs |
$0.6 |
|
20.5% |
|
“Between 2011 and 2015, both the employer and employee contribution to workers’ compensation in Washington declined, relative to covered payroll,” said Marjorie Baldwin, Professor at Arizona State University and co-author of the report. “However, the employer share declined at a more rapid pace—employer costs as a share of payroll fell 9 percent, while employee contributions fell 5 percent. As a result, Washington workers paid a slightly higher proportion of total workers’ compensation costs in 2015 (22 percent) than they did in 2011 (21 percent).” (See Figure 2).
Workers’ compensation, the nation’s first social insurance program, pays medical benefits to the providers of health care for injured workers, and cash benefits to workers whose injuries prevent them from working. Much of the interstate variation in benefit payments and employer costs can be attributed to different trends in employment and wages across states, rather than to structural differences in state workers’ compensation systems.
Other findings on workers’ compensation in Washington from the Academy’s report include:
- Growth in covered employment and payroll in Washington outpaced the rest of the nation between 2011 and 2015. In 2015, covered employment reached 3.1 million workers in the state, a 9.9 percent increase from 2011. Covered payroll was $172 billion in 2015, a 24.4 percent increase from 2011.
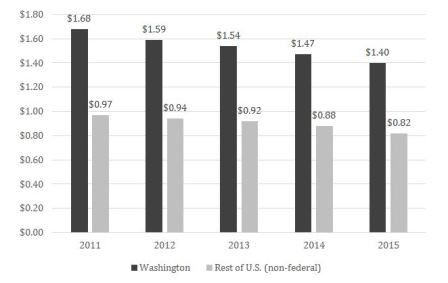
- Benefits paid as a share of payroll in Washington declined to $1.40 per $100 of covered payroll in 2015, down 16.7 percent from $1.68 in 2011 (Figure 1). Benefits as a share of payroll declined in the rest of the U.S. at a similar pace (-15.5 percent) over the same period (from $0.97 to $0.82).
Figure 1. Workers’ Compensation Benefits per $100 of Covered Payroll, 2011-2015: Washington and the Rest of the U.S. (non-federal)
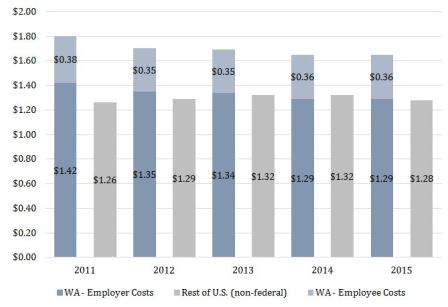
- Costs of workers’ compensation as a share of payroll in Washington also declined between 2011 and 2015 (Figure 2). In 2011, total costs per $100 of payroll were $1.80 ($1.42 in employer contributions, and $0.38 in worker contributions). Costs as a share of payroll declined to $1.65 in 2015 ($1.29 in employer contributions and $0.36 in employee contributions). In the rest of the U.S., average costs as a share of payroll increased from $1.26 in 2011 to $1.28 in 2015.
Figure 2. Workers’ Compensation Costs per $100 of Covered Payroll, 2011-2015: Washington and the Rest of the U.S. (non-federal)
Workers’ Compensation: Benefits, Coverage, and Costs (2015 data) is the 20th in an annual series. The report provides the only comprehensive data on workers’ compensation benefits, coverage, and costs for the nation, the states, the District of Columbia, and federal programs.
EXPERTS TO CONTACT:
| Christopher McLaren
National Academy of Social Insurance |
Marjorie Baldwin
Arizona State University (480) 965-7868
|
The National Academy of Social Insurance is a non-profit, nonpartisan organization made up of the nation’s leading experts on social insurance. Its mission is to advance solutions to challenges facing the nation by increasing public understanding of how social insurance contributes to economic security.
See related news: Disability, Workers' Compensation, Workforce Issues and Employee Benefits