For Immediate Release | October 5, 2017
Contact:
Jill Braunstein at (202) 452-8097
WASHINGTON, D.C. – Workers’ compensation benefits paid and employer costs dropped sharply in West Virginia in recent years, according to a new report from the National Academy of Social Insurance (the Academy).
In 2015, workers’ compensation benefits paid in West Virginia were $415 million, down from $523 million in 2011. West Virginia experienced a 20.7 percent decrease in total benefits paid over the period, the largest decline in the U.S. Total benefits paid increased 1.1 percent in the rest of the nation over the same period.
In West Virginia, there were large percentage decreases in both medical and cash benefits paid between 2011 and 2015. Cash benefits declined by 23.5 percent and medical spending by 17.5 percent. The reductions continue a downward trend that began when the state changed from an exclusive state fund to a private carrier system in 2008, along with substantial reductions in the statutory levels of benefits.
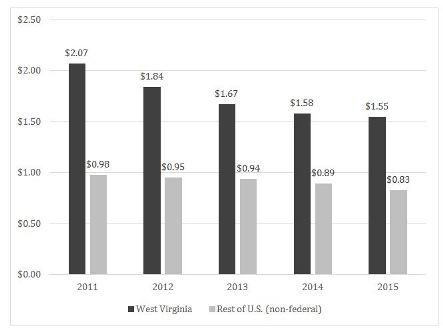
“Despite the sharp decline in total workers’ compensation benefits paid in West Virginia between 2011 and 2015, benefits per $100 covered wages were still nearly twice as high in West Virginia as in the rest of the U.S. as a whole,” said Marjorie Baldwin, Professor at Arizona State University and co-author of the report (See Figure 1 below).
West Virginia also experienced one of the biggest declines in employer costs for workers’ compensation between 2011 and 2015. Employer costs decreased 15.1 percent, a stark difference from the rest of the nation, which experienced a 21 percent increase in employer costs over the same period. In West Virginia the majority of the decrease in costs occurred between 2011 and 2013, when costs fell 12.0 percent.
Table 1. Workers’ Compensation Benefits, Coverage, and Costs: West Virginia and the Rest of the U.S. (non-federal)
|
2015 |
Percent Change 2011 to 2015 |
|||
|
WV |
Rest of U.S. |
WV |
Rest of U.S. |
|
| Aggregate Benefits, Coverage, and Costs | ||||
| Total Benefits (billions) |
$0.4 |
$57.7 |
-20.7% |
1.1% |
|
Medical Benefits |
$0.2 |
$29.7 |
-17.5% |
0.8% |
|
Cash Benefits |
$0.2 |
$28.0 |
-23.5% |
1.3% |
| Covered Workers (thousands) |
658 |
132,179 |
-0.7% |
8.0% |
| Covered Payroll (billions) |
$27 |
$6,946 |
6.1% |
19.3% |
| Total Costs (billions) |
$0.4 |
$89.5 |
-15.1% |
21.0% |
Workers’ compensation, the nation’s first social insurance program, pays medical benefits to the providers of health care for injured workers, and cash benefits to workers whose injuries prevent them from working. Much of the interstate variation in benefit payments and employer costs can be attributed to different trends in employment and wages across states, rather than to structural differences in state workers’ compensation systems.
“West Virginia has gone through a number of workers’ compensation legislative changes in the past decade or so that will influence benefits paid and employer costs,” said Christopher McLaren, Senior Researcher at the Academy and lead author of the report. “However, another big factor is West Virginia’s slow economic recovery after the Great Recession. West Virginia’s covered employment levels declined each year from 2012 to 2015, whereas employment is growing in the rest of the nation.”
Other findings on workers’ compensation in West Virginia from the Academy report include:
- In 2015, employment covered by workers’ compensation fell to 658,000 in West Virginia, down 0.7 percent from 2011. In contrast, covered employment increased between 2011 and 2015 in every other state. Covered payroll was $27 billion in West Virginia in 2015, up 6.1 percent from 2011.
- In 2015, benefits paid in West Virginia were $1.55 per $100 of covered payroll, down from $2.07 in 2011 (Figure 1). West Virginia experienced the largest decline in workers’ compensation benefits paid as a share of payroll of any state between 2011 and 2015.Benefits as a share of payroll fell in the rest of the U.S., but at a much more gradual pace.
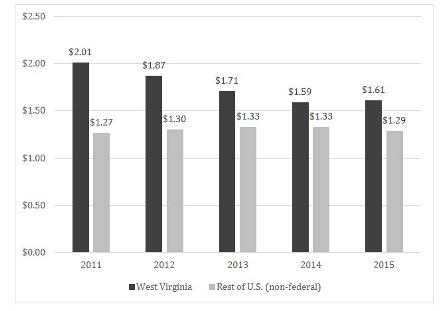
- Between 2011 and 2015, West Virginia also experienced the largest decrease in costs as a share of payroll in the country. Costs per $100 covered payroll were $1.61 in 2015, down from $2.01 in 2011 (Figure 2).
Figure 1. Workers’ Compensation Benefits per $100 of Covered Payroll, 2011-2015: West Virginia and the Rest of the U.S. (non-federal)
- Between 2011 and 2015, West Virginia also experienced the largest decrease in costs as a share of payroll in the country. Costs per $100 covered payroll were $1.61 in 2015, down from $2.01 in 2011 (Figure 2).
Figure 2. Workers’ Compensation Costs per $100 of Covered Payroll, 2011-2015:
West Virginia and the Rest of the U.S. (non-federal)
Workers’ Compensation: Benefits, Coverage, and Costs (2015 data) is the 20th in an annual series. The report provides the only comprehensive data on workers’ compensation benefits, coverage, and costs for the nation, the state, the District of Columbia, and federal programs.
EXPERTS TO CONTACT:
| Christopher McLaren
National Academy of Social Insurance |
Marjorie Baldwin
Arizona State University (480) 965-7868
|
The National Academy of Social Insurance is a non-profit, nonpartisan organization made up of the nation’s leading experts on social insurance. Its mission is to advance solutions to challenges facing the nation by increasing public understanding of how social insurance contributes to economic security.
See related news: Disability, Workers' Compensation, Workforce Issues and Employee Benefits