Poverty
The official poverty measure (OPM) in the U.S. fell from 22.4 percent of the population in 1959 to 10.5 percent in 2019,35Semega et al. 2020. Income and Poverty in the United States: 2019. Table B-5. U.S. Census Bureau. which suggests that economic insecurity—at least as measured by the portion of people who are in poverty—has fallen. These gains, however, were not steady or evenly shared. Figure 1 shows the percent of people in the U.S. who have been in poverty since 1959 (there are no data for certain subgroups—1959 and 1967, which is linearly interpolated with a dotted line).36U.S. Census Bureau. 2020. Historical Poverty Tables: People and Families – 1959 to 2019. Table 2, Poverty Status of People by Family Relationship, Race, and Hispanic Origin; and Table 3, Poverty Status of People by Age, Race, and Hispanic Origin. The figure also shows poverty rate by age groups—under 18, 18–64, and 65 and over. For most of the period here, age sixty-five was the full retirement age for Social Security Old Age Insurance benefits.37As a result of the Social Security Amendments of 1983, the age at which one receives full Social Security retirement benefits began increasing from sixty-five to sixty-seven in the year 2000. The full retirement age reached sixty-seven in 2022.
Figure 1. U.S. Official Poverty Rate, Total and by Age Group, 1959–2019
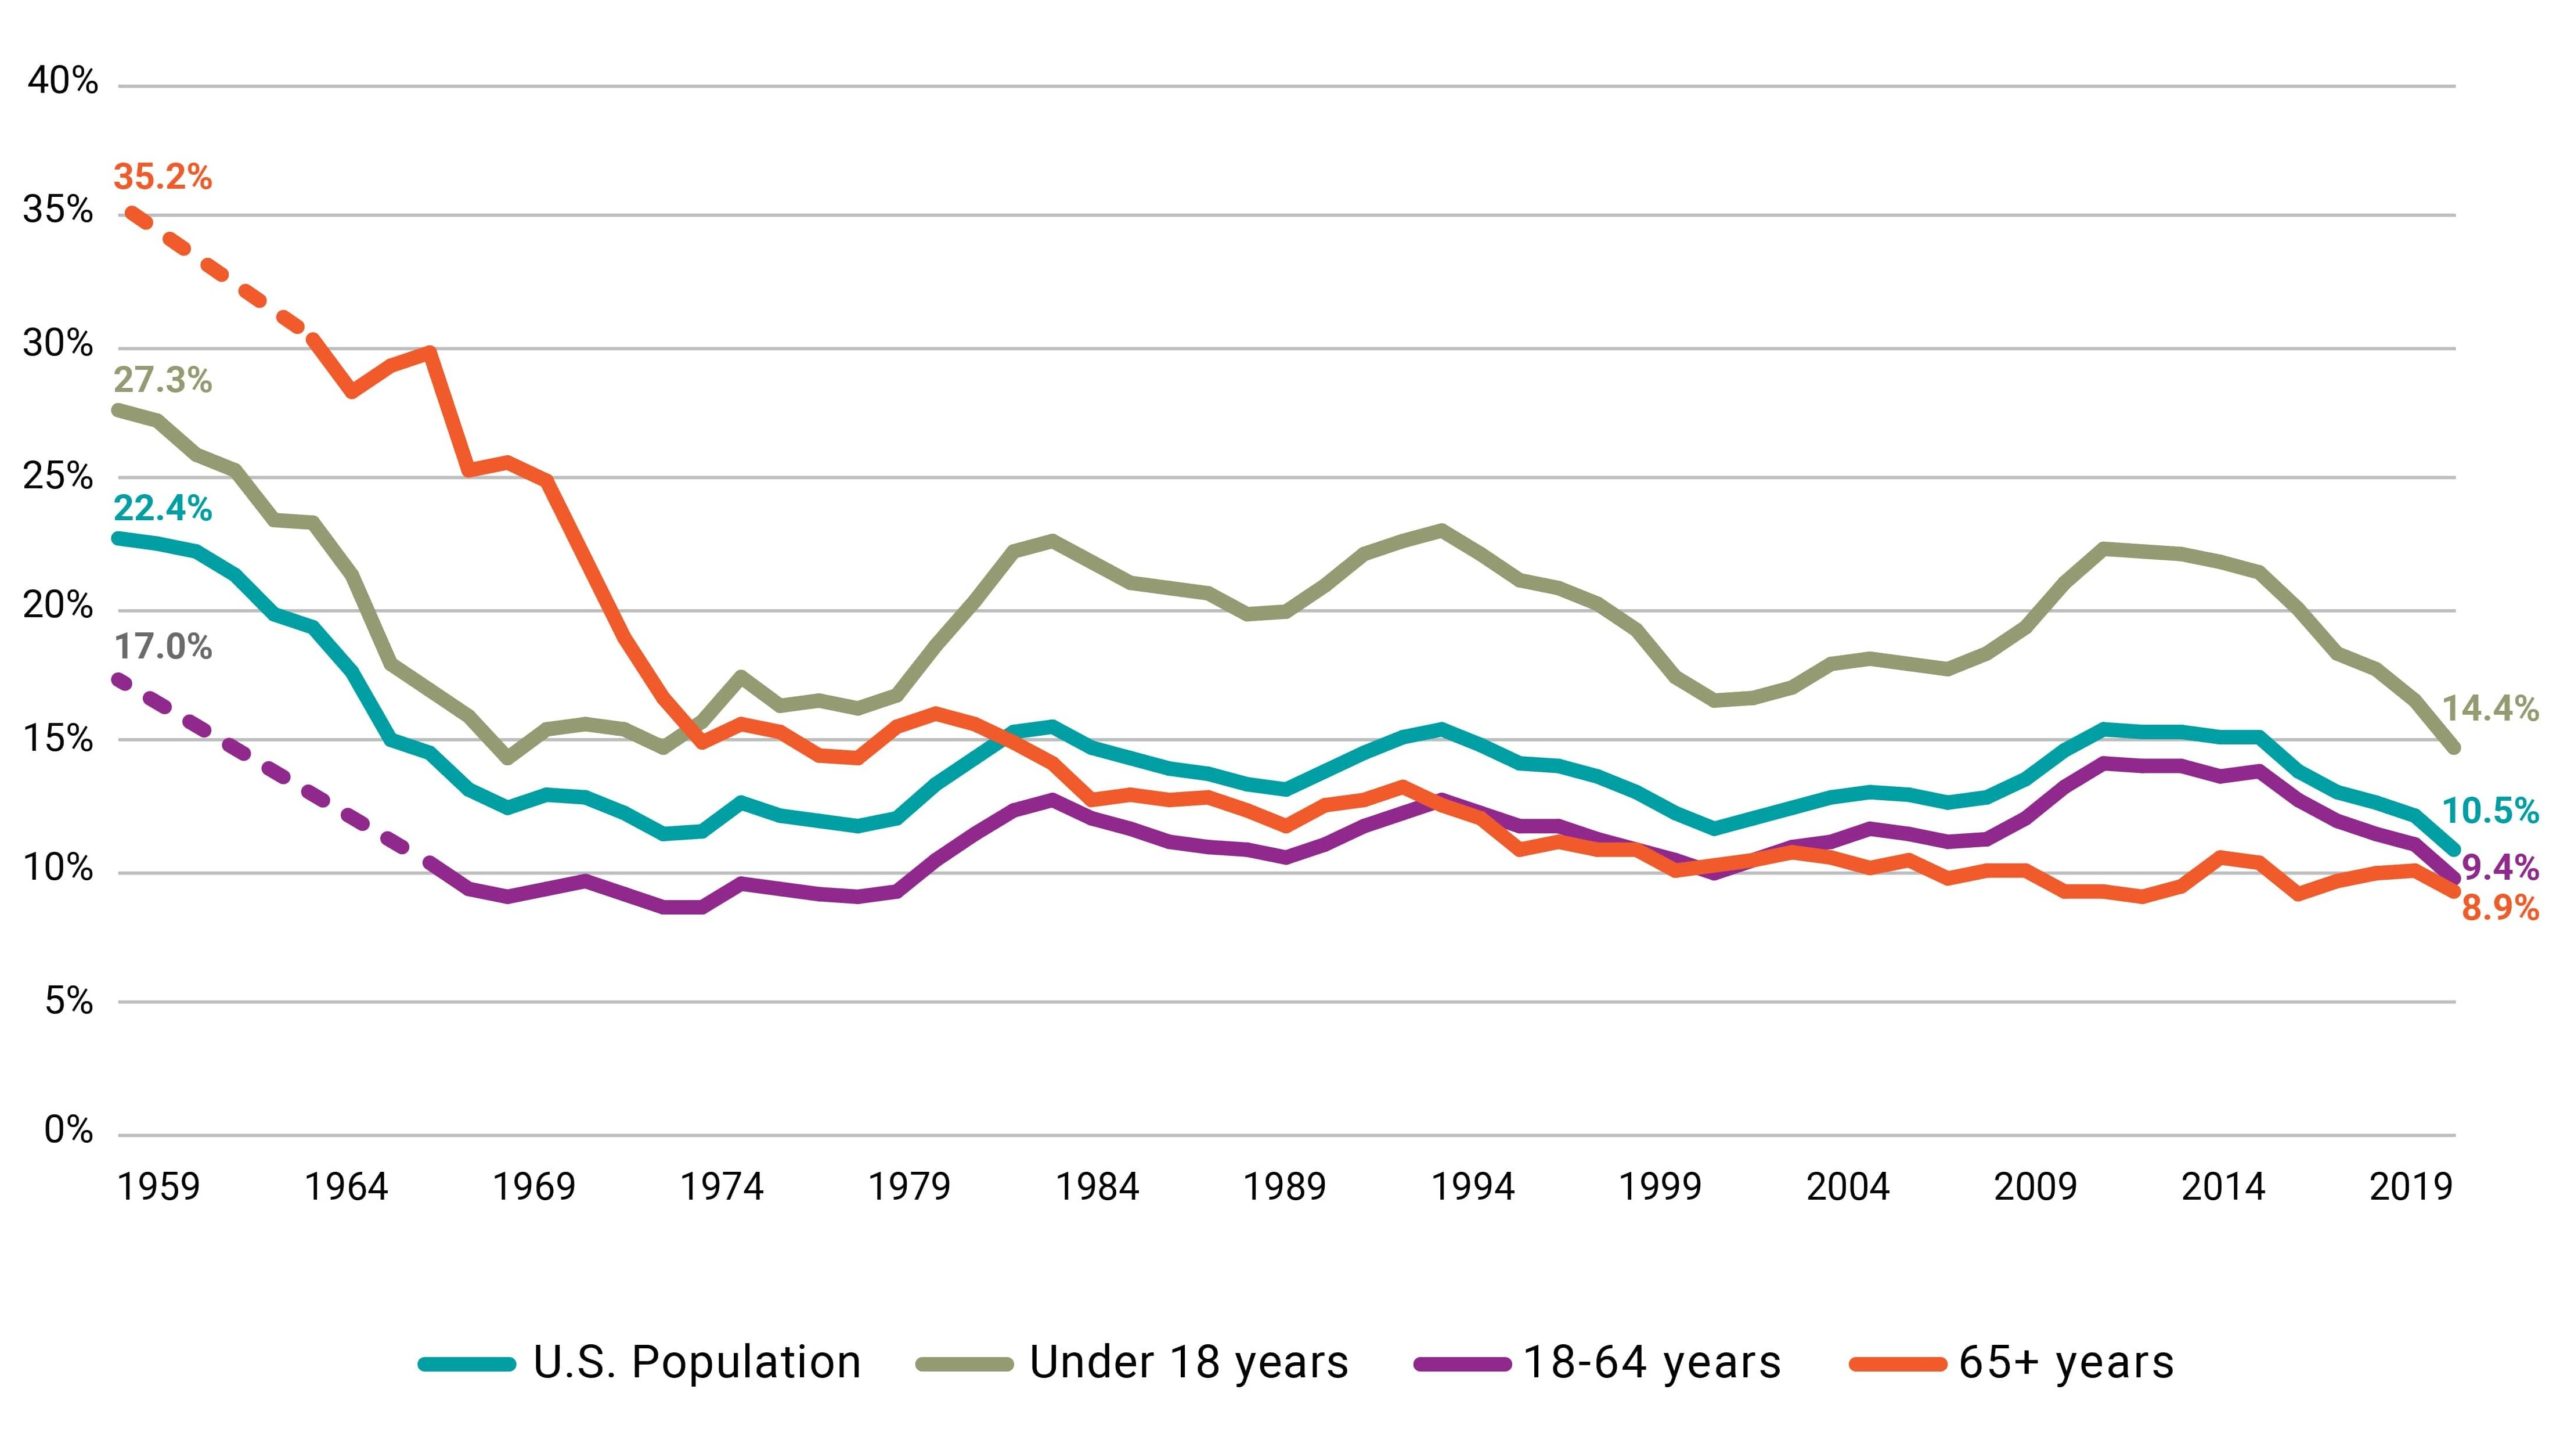
For children and adults under sixty-five, the reduction in poverty occurred in the initial period of measurement, from 1959 to 1973. In the nearly five decades since, the poverty rate has fluctuated between 11 percent and 15 percent. For adults over sixty-five, in contrast, the proportion in poverty has been on a slow and steady decrease, falling to 8.9 percent in 2019.38The reduction in poverty among the 65+ population is largely attributed to Social Security providing a significant and steady stream of income in retirement. While that population is the most impacted by Social Security, the program provides substantial poverty relief for the population under age sixty-five. The program is estimated to have lifted almost seven million children and adults out of poverty in 2018. Read more in Social Security Lifts More Americans above Poverty Than Any Other Program.
Breaking down poverty by race reveals deep disparities. In 2019—a record year of poverty lows under the OPM—18.8 percent of the Black population, 15.7 percent of the Hispanic population, 7.3 percent of the non-Hispanic White, and 7.1 percent of the Asian population were in poverty. Over the thirty years from 1989 to 2018, OPM poverty rates averaged 26.4 percent for the Black population, 24.4 percent for the Hispanic population, 11.9 percent for the Asian population, and 8.8 percent for the non-Hispanic White population.39U.S. Census Bureau. 2020. Historical Poverty Tables: People and Families—1959 to 2019. Table 2, Poverty Status of People by Family Relationship, Race, and Hispanic Origin.
Reaching an overall poverty rate of 10.5 percent in 2019 was a milestone, but experts expect data to show an increase in poverty in 2020 due to the COVID-19 pandemic.
The official poverty rate cannot be interpreted as an exhaustive estimate of economic insecurity. There are two key problems.
First, the official measure is generally recognized as flawed. Specifically, it counts the number of people who have cash income below a certain threshold, but that threshold only increases with inflation. Wages rise faster than prices (this is how standards of living increase), so although the threshold increases every year, the actual number becomes less meaningful as a measure of poverty relative to trends in the economy. In 1959, for example, the family of four threshold was $2,973, which represented 55 percent of median family income. In 2019, the threshold was $26,172, or 38 percent of median family income.40Source (poverty threshold data): U.S. Census Bureau. 2020. Historical Poverty Tables: People and Families—1959 to 2019. Table 1, Weighted Average Poverty Thresholds for Families of Specified Size: 1959 to 2019.Source (1959 median income): U.S. Census Bureau. 1961. Income of Families and Persons in the United States: 1959.Source (2019 median income): U.S. Census Bureau. 2020. Historical Income Tables: Households. Table H-6, Regions, by Median and Mean Income.
The other problem with the official poverty rate is that it only measures pre-tax cash income, and therefore does not capture post-tax transfers or noncash support programs. So Social Security, a cash benefit not subject to the income tax,41Higher-income Social Security beneficiaries may see a portion of their benefits subject to the income tax. Read more on the Social Security Administration (SSA) website. is counted, but the Earned Income Tax Credit (EITC) and Supplemental Nutrition Assistance Program (SNAP, initially Food Stamps) are not. This means that the official poverty measure accurately reflects cash income but not all income resources. The U.S. Census Bureau developed the Supplemental Poverty Measure (SPM) to take those post-tax transfers and in-kind benefits into account (among numerous other changes). Prior research found that under the SPM accounting, these income support programs have powerful anti-poverty effects that have resulted in significant reductions in poverty rates in recent decades.42Poverty in the United States: 50-Year Trends and Safety Net Impacts (Chaudry et al. 2016) shows tax and transfer programs as reducing poverty by 12.7 percentage points in 2012. Figures 7 through 16 document the anti-poverty impacts of an array of income security programs in the U.S. Still, that accounting found that 11.7 percent of the population was poor in 2019.43Short, Kathleen. 2011. The Research SUPPLEMENTAL POVERTY MEASURE: 2010. U.S. Census Bureau, P60-241; Fox, Liana. 2020. The Supplemental Poverty Measure: 2019. U.S. Census Bureau, P60-272.
An alternative definition of poverty is used by the Organisation of Economic Co-operation and Development (OECD)44Initially formed in 1961 by twenty-one national governments in Europe and North America, the OECD now includes thirty-seven member countries. Whenever making international comparisons along economic metrics, the US should be compared to the OECD countries only or the subset of the most advanced economies within the OECD (known as the G7): Canada, France, Germany, Italy, Japan, and the United Kingdom. ; it defines poverty as 50 percent of median income in a given country.45The OECD’s definition is justified by “the notion that avoiding poverty means an ability to access the goods and services that are regarded as customary or the norm in any given country.”OECD. 2019. Society at a Glance 2019: OECD Social Indicators. OECD Publishing, Paris. Chapter 6. https://doi.org/10.1787/soc_glance-2019-en. According to this definition, the poverty rate in the U.S. after taxes and transfers was 17.8 percent in 2017.46OECD. 2021. Poverty Rate (Indicator). doi: 10.1787/0fe1315d-en
If we were to assume that poverty was an exhaustive measure of economic insecurity in the U.S., we would then be left with the conclusion that the U.S. labor market has made little progress in reducing economic insecurity over the past forty years and has been greatly bolstered by public support programs.
But it is incorrect to equate poverty with insecurity. Poverty measures income, not precarity, though it is arguably the best measure of precarity at our disposal. It should be considered necessary but not sufficient; that is, even if we assume that nearly all individuals in poverty are economically insecure, there are individuals who are not in poverty who are also economically insecure.
During the pandemic, it was not solely the 10.5 percent of the population that was in poverty at the start of 2020 that was affected by the recession. In December 2020, 37.5 percent of adults reported that it had been at least somewhat difficult paying for “usual household expenses,”47U.S. Census Bureau. 2021. Week 21 Household Pulse Survey: December 9–December 21. Spending Tables, Table 1. , 13.7 percent of adults were in households where there was not enough food to eat sometimes or often over the previous week,48U.S. Census Bureau. 2021. Week 21 Household Pulse Survey: December 9–December 21. Food Sufficiency and Food Security Tables, Table 2. , and 18.1 percent of renter-occupied households were behind on rent.49U.S. Census Bureau. 2021. Week 21 Household Pulse Survey: December 9–December 21. Housing Tables, Table 1b. Of those behind on rent, more than 52 percent reported it as at least somewhat likely that they would be evicted in the next two months.50United States Census Bureau. 2021. Week 21 Household Pulse Survey: December 9–December 21. Housing Tables, Table 3b. Precarity extended far above the threshold for poverty.
- 35Semega et al. 2020. Income and Poverty in the United States: 2019. Table B-5. U.S. Census Bureau.
- 36U.S. Census Bureau. 2020. Historical Poverty Tables: People and Families – 1959 to 2019. Table 2, Poverty Status of People by Family Relationship, Race, and Hispanic Origin; and Table 3, Poverty Status of People by Age, Race, and Hispanic Origin.
- 37As a result of the Social Security Amendments of 1983, the age at which one receives full Social Security retirement benefits began increasing from sixty-five to sixty-seven in the year 2000. The full retirement age reached sixty-seven in 2022.
- 38The reduction in poverty among the 65+ population is largely attributed to Social Security providing a significant and steady stream of income in retirement. While that population is the most impacted by Social Security, the program provides substantial poverty relief for the population under age sixty-five. The program is estimated to have lifted almost seven million children and adults out of poverty in 2018. Read more in Social Security Lifts More Americans above Poverty Than Any Other Program.
- 39U.S. Census Bureau. 2020. Historical Poverty Tables: People and Families—1959 to 2019. Table 2, Poverty Status of People by Family Relationship, Race, and Hispanic Origin.
- 40Source (poverty threshold data): U.S. Census Bureau. 2020. Historical Poverty Tables: People and Families—1959 to 2019. Table 1, Weighted Average Poverty Thresholds for Families of Specified Size: 1959 to 2019.Source (1959 median income): U.S. Census Bureau. 1961. Income of Families and Persons in the United States: 1959.Source (2019 median income): U.S. Census Bureau. 2020. Historical Income Tables: Households. Table H-6, Regions, by Median and Mean Income.
- 41Higher-income Social Security beneficiaries may see a portion of their benefits subject to the income tax. Read more on the Social Security Administration (SSA) website.
- 42Poverty in the United States: 50-Year Trends and Safety Net Impacts (Chaudry et al. 2016) shows tax and transfer programs as reducing poverty by 12.7 percentage points in 2012. Figures 7 through 16 document the anti-poverty impacts of an array of income security programs in the U.S.
- 43Short, Kathleen. 2011. The Research SUPPLEMENTAL POVERTY MEASURE: 2010. U.S. Census Bureau, P60-241; Fox, Liana. 2020. The Supplemental Poverty Measure: 2019. U.S. Census Bureau, P60-272.
- 44Initially formed in 1961 by twenty-one national governments in Europe and North America, the OECD now includes thirty-seven member countries. Whenever making international comparisons along economic metrics, the US should be compared to the OECD countries only or the subset of the most advanced economies within the OECD (known as the G7): Canada, France, Germany, Italy, Japan, and the United Kingdom.
- 45The OECD’s definition is justified by “the notion that avoiding poverty means an ability to access the goods and services that are regarded as customary or the norm in any given country.”OECD. 2019. Society at a Glance 2019: OECD Social Indicators. OECD Publishing, Paris. Chapter 6. https://doi.org/10.1787/soc_glance-2019-en.
- 46OECD. 2021. Poverty Rate (Indicator). doi: 10.1787/0fe1315d-en
- 47U.S. Census Bureau. 2021. Week 21 Household Pulse Survey: December 9–December 21. Spending Tables, Table 1.
- 48U.S. Census Bureau. 2021. Week 21 Household Pulse Survey: December 9–December 21. Food Sufficiency and Food Security Tables, Table 2.
- 49U.S. Census Bureau. 2021. Week 21 Household Pulse Survey: December 9–December 21. Housing Tables, Table 1b.
- 50United States Census Bureau. 2021. Week 21 Household Pulse Survey: December 9–December 21. Housing Tables, Table 3b.
Poverty
The official poverty measure (OPM) in the U.S. fell from 22.4 percent of the population in 1959 to 10.5 percent in 2019,35Semega et al. 2020. Income and Poverty in the United States: 2019. Table B-5. U.S. Census Bureau. which suggests that economic insecurity—at least as measured by the portion of people who are in poverty—has fallen. These gains, however, were not steady or evenly shared. Figure 1 shows the percent of people in the U.S. who have been in poverty since 1959 (there are no data for certain subgroups—1959 and 1967, which is linearly interpolated with a dotted line).36U.S. Census Bureau. 2020. Historical Poverty Tables: People and Families – 1959 to 2019. Table 2, Poverty Status of People by Family Relationship, Race, and Hispanic Origin; and Table 3, Poverty Status of People by Age, Race, and Hispanic Origin. The figure also shows poverty rate by age groups—under 18, 18–64, and 65 and over. For most of the period here, age sixty-five was the full retirement age for Social Security Old Age Insurance benefits.37As a result of the Social Security Amendments of 1983, the age at which one receives full Social Security retirement benefits began increasing from sixty-five to sixty-seven in the year 2000. The full retirement age reached sixty-seven in 2022.
Figure 1. U.S. Official Poverty Rate, Total and by Age Group, 1959–2019
For children and adults under sixty-five, the reduction in poverty occurred in the initial period of measurement, from 1959 to 1973. In the nearly five decades since, the poverty rate has fluctuated between 11 percent and 15 percent. For adults over sixty-five, in contrast, the proportion in poverty has been on a slow and steady decrease, falling to 8.9 percent in 2019.38The reduction in poverty among the 65+ population is largely attributed to Social Security providing a significant and steady stream of income in retirement. While that population is the most impacted by Social Security, the program provides substantial poverty relief for the population under age sixty-five. The program is estimated to have lifted almost seven million children and adults out of poverty in 2018. Read more in Social Security Lifts More Americans above Poverty Than Any Other Program.
Breaking down poverty by race reveals deep disparities. In 2019—a record year of poverty lows under the OPM—18.8 percent of the Black population, 15.7 percent of the Hispanic population, 7.3 percent of the non-Hispanic White, and 7.1 percent of the Asian population were in poverty. Over the thirty years from 1989 to 2018, OPM poverty rates averaged 26.4 percent for the Black population, 24.4 percent for the Hispanic population, 11.9 percent for the Asian population, and 8.8 percent for the non-Hispanic White population.39U.S. Census Bureau. 2020. Historical Poverty Tables: People and Families—1959 to 2019. Table 2, Poverty Status of People by Family Relationship, Race, and Hispanic Origin.
Reaching an overall poverty rate of 10.5 percent in 2019 was a milestone, but experts expect data to show an increase in poverty in 2020 due to the COVID-19 pandemic.
The official poverty rate cannot be interpreted as an exhaustive estimate of economic insecurity. There are two key problems.
First, the official measure is generally recognized as flawed. Specifically, it counts the number of people who have cash income below a certain threshold, but that threshold only increases with inflation. Wages rise faster than prices (this is how standards of living increase), so although the threshold increases every year, the actual number becomes less meaningful as a measure of poverty relative to trends in the economy. In 1959, for example, the family of four threshold was $2,973, which represented 55 percent of median family income. In 2019, the threshold was $26,172, or 38 percent of median family income.40Source (poverty threshold data): U.S. Census Bureau. 2020. Historical Poverty Tables: People and Families—1959 to 2019. Table 1, Weighted Average Poverty Thresholds for Families of Specified Size: 1959 to 2019.Source (1959 median income): U.S. Census Bureau. 1961. Income of Families and Persons in the United States: 1959.Source (2019 median income): U.S. Census Bureau. 2020. Historical Income Tables: Households. Table H-6, Regions, by Median and Mean Income.
The other problem with the official poverty rate is that it only measures pre-tax cash income, and therefore does not capture post-tax transfers or noncash support programs. So Social Security, a cash benefit not subject to the income tax,41Higher-income Social Security beneficiaries may see a portion of their benefits subject to the income tax. Read more on the Social Security Administration (SSA) website. is counted, but the Earned Income Tax Credit (EITC) and Supplemental Nutrition Assistance Program (SNAP, initially Food Stamps) are not. This means that the official poverty measure accurately reflects cash income but not all income resources. The U.S. Census Bureau developed the Supplemental Poverty Measure (SPM) to take those post-tax transfers and in-kind benefits into account (among numerous other changes). Prior research found that under the SPM accounting, these income support programs have powerful anti-poverty effects that have resulted in significant reductions in poverty rates in recent decades.42Poverty in the United States: 50-Year Trends and Safety Net Impacts (Chaudry et al. 2016) shows tax and transfer programs as reducing poverty by 12.7 percentage points in 2012. Figures 7 through 16 document the anti-poverty impacts of an array of income security programs in the U.S. Still, that accounting found that 11.7 percent of the population was poor in 2019.43Short, Kathleen. 2011. The Research SUPPLEMENTAL POVERTY MEASURE: 2010. U.S. Census Bureau, P60-241; Fox, Liana. 2020. The Supplemental Poverty Measure: 2019. U.S. Census Bureau, P60-272.
An alternative definition of poverty is used by the Organisation of Economic Co-operation and Development (OECD)44Initially formed in 1961 by twenty-one national governments in Europe and North America, the OECD now includes thirty-seven member countries. Whenever making international comparisons along economic metrics, the US should be compared to the OECD countries only or the subset of the most advanced economies within the OECD (known as the G7): Canada, France, Germany, Italy, Japan, and the United Kingdom. ; it defines poverty as 50 percent of median income in a given country.45The OECD’s definition is justified by “the notion that avoiding poverty means an ability to access the goods and services that are regarded as customary or the norm in any given country.”OECD. 2019. Society at a Glance 2019: OECD Social Indicators. OECD Publishing, Paris. Chapter 6. https://doi.org/10.1787/soc_glance-2019-en. According to this definition, the poverty rate in the U.S. after taxes and transfers was 17.8 percent in 2017.46OECD. 2021. Poverty Rate (Indicator). doi: 10.1787/0fe1315d-en
If we were to assume that poverty was an exhaustive measure of economic insecurity in the U.S., we would then be left with the conclusion that the U.S. labor market has made little progress in reducing economic insecurity over the past forty years and has been greatly bolstered by public support programs.
But it is incorrect to equate poverty with insecurity. Poverty measures income, not precarity, though it is arguably the best measure of precarity at our disposal. It should be considered necessary but not sufficient; that is, even if we assume that nearly all individuals in poverty are economically insecure, there are individuals who are not in poverty who are also economically insecure.
During the pandemic, it was not solely the 10.5 percent of the population that was in poverty at the start of 2020 that was affected by the recession. In December 2020, 37.5 percent of adults reported that it had been at least somewhat difficult paying for “usual household expenses,”47U.S. Census Bureau. 2021. Week 21 Household Pulse Survey: December 9–December 21. Spending Tables, Table 1. , 13.7 percent of adults were in households where there was not enough food to eat sometimes or often over the previous week,48U.S. Census Bureau. 2021. Week 21 Household Pulse Survey: December 9–December 21. Food Sufficiency and Food Security Tables, Table 2. , and 18.1 percent of renter-occupied households were behind on rent.49U.S. Census Bureau. 2021. Week 21 Household Pulse Survey: December 9–December 21. Housing Tables, Table 1b. Of those behind on rent, more than 52 percent reported it as at least somewhat likely that they would be evicted in the next two months.50United States Census Bureau. 2021. Week 21 Household Pulse Survey: December 9–December 21. Housing Tables, Table 3b. Precarity extended far above the threshold for poverty.
- 35Semega et al. 2020. Income and Poverty in the United States: 2019. Table B-5. U.S. Census Bureau.
- 36U.S. Census Bureau. 2020. Historical Poverty Tables: People and Families – 1959 to 2019. Table 2, Poverty Status of People by Family Relationship, Race, and Hispanic Origin; and Table 3, Poverty Status of People by Age, Race, and Hispanic Origin.
- 37As a result of the Social Security Amendments of 1983, the age at which one receives full Social Security retirement benefits began increasing from sixty-five to sixty-seven in the year 2000. The full retirement age reached sixty-seven in 2022.
- 38The reduction in poverty among the 65+ population is largely attributed to Social Security providing a significant and steady stream of income in retirement. While that population is the most impacted by Social Security, the program provides substantial poverty relief for the population under age sixty-five. The program is estimated to have lifted almost seven million children and adults out of poverty in 2018. Read more in Social Security Lifts More Americans above Poverty Than Any Other Program.
- 39U.S. Census Bureau. 2020. Historical Poverty Tables: People and Families—1959 to 2019. Table 2, Poverty Status of People by Family Relationship, Race, and Hispanic Origin.
- 40Source (poverty threshold data): U.S. Census Bureau. 2020. Historical Poverty Tables: People and Families—1959 to 2019. Table 1, Weighted Average Poverty Thresholds for Families of Specified Size: 1959 to 2019.Source (1959 median income): U.S. Census Bureau. 1961. Income of Families and Persons in the United States: 1959.Source (2019 median income): U.S. Census Bureau. 2020. Historical Income Tables: Households. Table H-6, Regions, by Median and Mean Income.
- 41Higher-income Social Security beneficiaries may see a portion of their benefits subject to the income tax. Read more on the Social Security Administration (SSA) website.
- 42Poverty in the United States: 50-Year Trends and Safety Net Impacts (Chaudry et al. 2016) shows tax and transfer programs as reducing poverty by 12.7 percentage points in 2012. Figures 7 through 16 document the anti-poverty impacts of an array of income security programs in the U.S.
- 43Short, Kathleen. 2011. The Research SUPPLEMENTAL POVERTY MEASURE: 2010. U.S. Census Bureau, P60-241; Fox, Liana. 2020. The Supplemental Poverty Measure: 2019. U.S. Census Bureau, P60-272.
- 44Initially formed in 1961 by twenty-one national governments in Europe and North America, the OECD now includes thirty-seven member countries. Whenever making international comparisons along economic metrics, the US should be compared to the OECD countries only or the subset of the most advanced economies within the OECD (known as the G7): Canada, France, Germany, Italy, Japan, and the United Kingdom.
- 45The OECD’s definition is justified by “the notion that avoiding poverty means an ability to access the goods and services that are regarded as customary or the norm in any given country.”OECD. 2019. Society at a Glance 2019: OECD Social Indicators. OECD Publishing, Paris. Chapter 6. https://doi.org/10.1787/soc_glance-2019-en.
- 46OECD. 2021. Poverty Rate (Indicator). doi: 10.1787/0fe1315d-en
- 47U.S. Census Bureau. 2021. Week 21 Household Pulse Survey: December 9–December 21. Spending Tables, Table 1.
- 48U.S. Census Bureau. 2021. Week 21 Household Pulse Survey: December 9–December 21. Food Sufficiency and Food Security Tables, Table 2.
- 49U.S. Census Bureau. 2021. Week 21 Household Pulse Survey: December 9–December 21. Housing Tables, Table 1b.
- 50United States Census Bureau. 2021. Week 21 Household Pulse Survey: December 9–December 21. Housing Tables, Table 3b.