Income Volatility
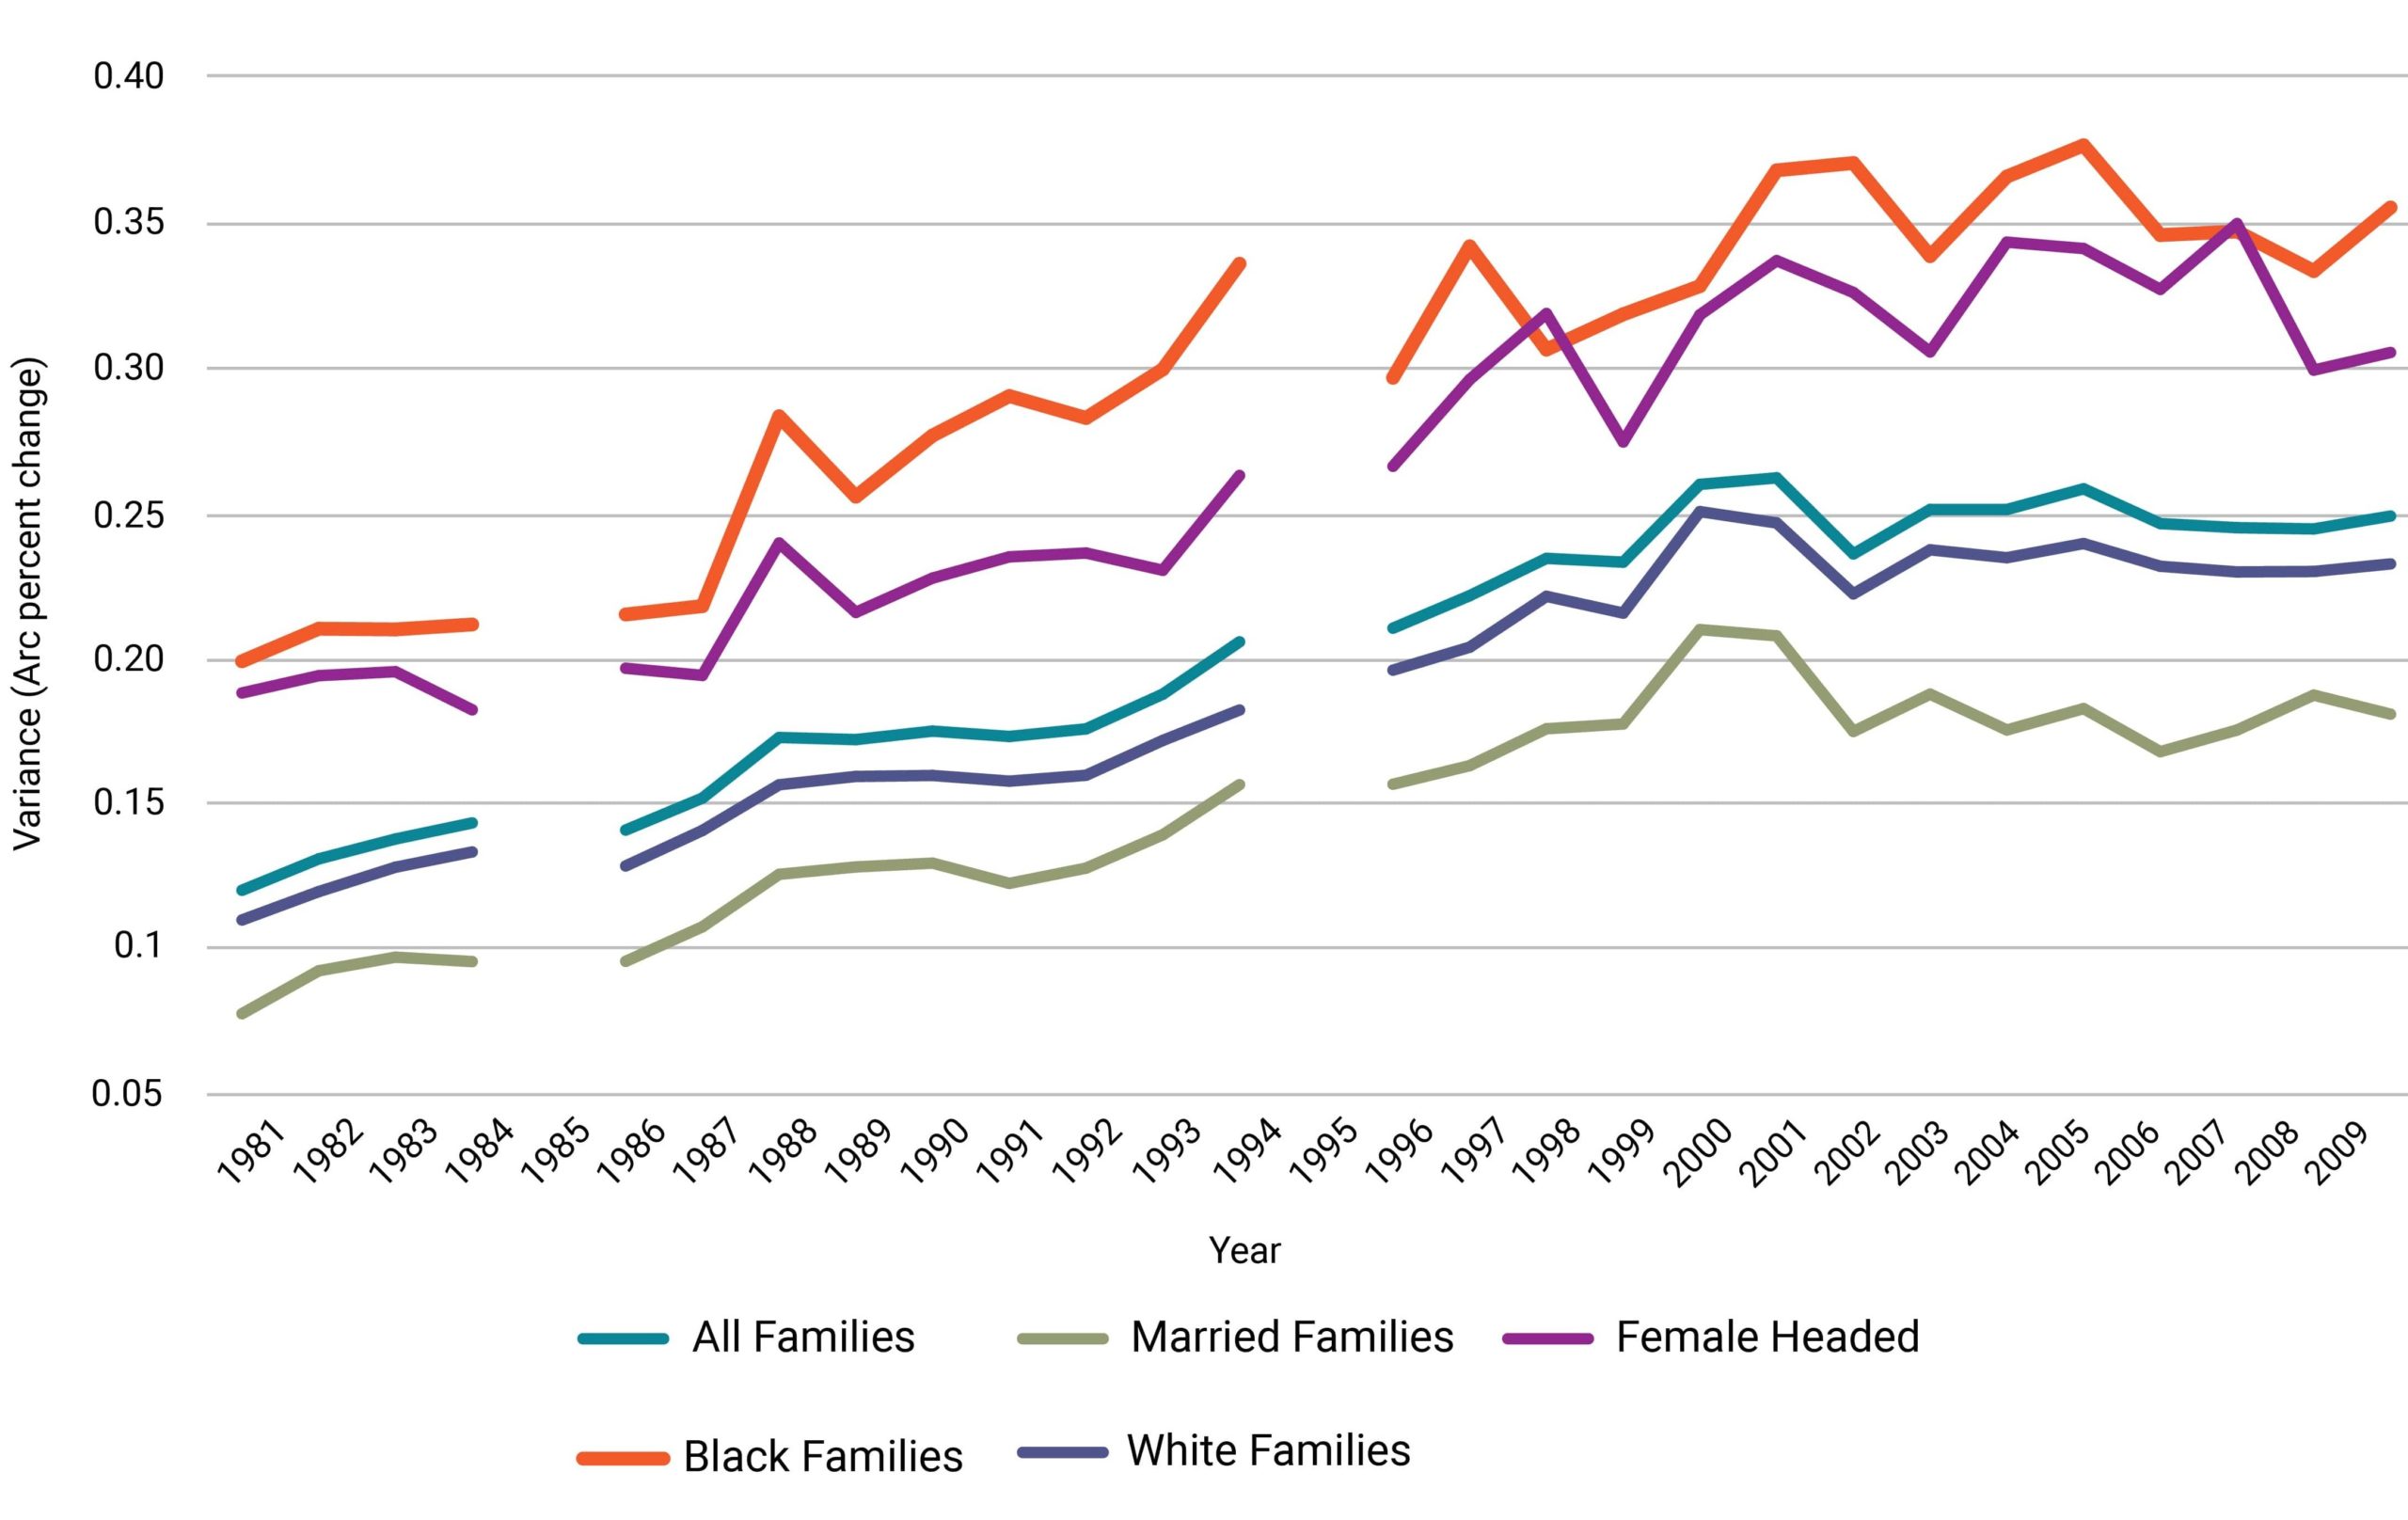
The last component of economic insecurity is income volatility: month-to-month or year-to-year fluctuations in income.95The Financial Diaries Project and The Fragile Families and Child Wellbeing Study delve into income instability, and Jonathan Morduch, Kathryn Edin, and Katherine Newman have all contributed extensively to this literature. A number of studies have documented the increase in income volatility in the U.S. over the past four decades.96In income volatility literature, “permanent” and “transitory” shocks to income are frequently discussed. The former describes a shock with a “long-lasting effect which does not go away, even partially,” and the latter, a shock that affects earnings over a short period of time but does not permanently impact one’s future earning trajectory. While permanent negative shocks are more harmful, transitory negative shocks can be extremely difficult for households to manage as well. “Gross volatility” encompasses both permanent and transitory shocks.Moffit and Zhang 2018 “find that both gross volatility [of male income] and the component consisting of only the variance of transitory shocks have experienced a large increase during the Great Recession after following similar trends to those previously established showing upward trends from the 1970s to the 1980s followed by a stable period until the Recession.” Last, Western et al. 2016 find that large income losses have become more common than large income gains for low-income children between the mid-1990s and 2010. Moffit and Zhang provide an extensive overview of existing literature on income volatility in Tables 1–3 on pages 43–48. One study estimates that between 1980 and 2009, volatility in family income doubled. The increase in volatility was most stark at the top 1 percent of the income distribution, though income volatility for the bottom 10 percent of earners exceeded that of the top in any given year. Figure 9, pulled from that study, shows this increasing trend broken down by married families, female-headed families, Black families, and White families by graphing the variance in income.97Hardy, Bradley and James P. Ziliak. 2014. Decomposing Trends in Income Inequality: The “Wild Ride” at the Top and the Bottom. Economic Inquiry. Vol. 52, No. 1. p. 459–476. While income volatility is increasing across the board, Black families and female-headed families have consistently faced the least stable incomes.
Figure 9. Trends in Disposable Income by Race and Family Structure, 1981–2009
This volatility in income, which can also be thought of as income unpredictability, is not without consequences. The Federal Reserve estimates that 10 percent of households experience hardship related to unstable income.98Board of Governors of the Federal Reserve System. 2020. Report on the Economic Well-Being of U.S. Households in 2019–May 2020. Income. Table 6. Further, household income instability reduces engagement at school among adolescents and helps predict “adolescent expulsions and suspensions, particularly among low-income, older, and racial minority adolescents.”99Gennetian, Lisa A., Sharon Wolf, Heather D. Hill, and Pamela A. Morris. 2015. Intrayear Household Income Dynamics and Adolescent School Behavior. Demography. Apr;52(2):455-83. doi: 10.1007/s13524-015-0370-9. PMID: 25735265.
The U.S. Financial Diaries100See U.S. Financial Diaries. project was designed to take a close look at the extent of income volatility among households and how families try to cope with these changes in income. The project tracked the finances of 235 low- and moderate-income households (which they define relative to the federal poverty line, area median incomes, and the Supplemental Poverty Measure) during the period July 2012 through June 2013 to study how U.S. households experience volatility and insecurity. The project found that three out of four households saw income vary by at least 22 percent month to month. A third of those households (25 percent of the total studied) had monthly incomes varying by over 48 percent.10183 Charts to Describe the Hidden Financial Lives of Working Americans. Chart 2.4. These data do not include income shocks from tax refunds or credits. These swings are large. At 22 percent variance, a family with $2,000 in income in one month can expect an income somewhere between $1,600 and $2,400 the following month. That $800 swing is difficult to plan around in both the short term (such as meeting exigencies like buying food or paying rent) or in the medium or long term (such as saving for a house or retirement).
The Financial Diaries Project also confirmed how little cushion most families had. The average “emergency savings” of the families included in the project was $1,788, but the median emergency savings was $55—and 45 percent of households had no emergency savings at all.10283 Charts to Describe the Hidden Financial Lives of Working Americans. Charts 4.1–4.2.
The lack of predictability in income—especially for those who do not have savings—is at the heart of economic insecurity. Households cannot be expected to plan for shocks like job loss and the death of a breadwinner when they cannot reliably plan how they will meet short-term costs of living.
The ability to maintain one’s income level in the face of unpredictable changes or unstable sources can be aided through access to credit and banking. Taking the example of the $2,000 monthly income that has a 50 percent chance of being $400 higher or lower in a given month: In theory, $1,600 in a month may be insufficient to pay for all necessary expenses, but a credit card can fill in the difference and can be paid off during a $2,400 month. However, given the unpredictability of volatility, it is difficult in practice to know whether an accrued debt can be paid off in the future.
In addition, access to credit is not universal. As a parallel to having less access to banks, Black individuals also have a more difficult time obtaining credit. When looking at credit application denials in groups of individuals with similar incomes, Black individuals had more credit denials than White individuals or Hispanic individuals, by a factor of two or three.103Board of Governors of the Federal Reserve System. 2020. Report on the Economic Well-Being of U.S. Households in 2019–May 2020. Banking and Credit. Table 12.
Table 5. Credit Applicants with Adverse Outcomes, 2019
| Family Income and Race |
Denied | Denied or Approved for Less than Requested |
| Less than $40,000 | ||
| White | 40 | 48 |
| Black | 58 | 68 |
| Hispanic | 41 | 49 |
| Overall | 43 | 51 |
| $40,000 – $100,000 | ||
| White | 17 | 22 |
| Black | 41 | 57 |
| Hispanic | 30 | 39 |
| Overall | 22 | 29 |
| Greater than $100,000 | ||
| White | 7 | 10 |
| Black | 19 | 31 |
| Hispanic | 17 | 22 |
| Overall | 9 | 13 |
| All incomes | ||
| White | 19 | 24 |
| Black | 44 | 57 |
| Hispanic | 32 | 40 |
| Overall | 24 | 31 |
Income volatility is increasing and presents a hardship for many families. Without stable or reliable incomes, it can be difficult to establish a base of economic security.
- 95The Financial Diaries Project and The Fragile Families and Child Wellbeing Study delve into income instability, and Jonathan Morduch, Kathryn Edin, and Katherine Newman have all contributed extensively to this literature.
- 96In income volatility literature, “permanent” and “transitory” shocks to income are frequently discussed. The former describes a shock with a “long-lasting effect which does not go away, even partially,” and the latter, a shock that affects earnings over a short period of time but does not permanently impact one’s future earning trajectory. While permanent negative shocks are more harmful, transitory negative shocks can be extremely difficult for households to manage as well. “Gross volatility” encompasses both permanent and transitory shocks.Moffit and Zhang 2018 “find that both gross volatility [of male income] and the component consisting of only the variance of transitory shocks have experienced a large increase during the Great Recession after following similar trends to those previously established showing upward trends from the 1970s to the 1980s followed by a stable period until the Recession.” Last, Western et al. 2016 find that large income losses have become more common than large income gains for low-income children between the mid-1990s and 2010. Moffit and Zhang provide an extensive overview of existing literature on income volatility in Tables 1–3 on pages 43–48.
- 97Hardy, Bradley and James P. Ziliak. 2014. Decomposing Trends in Income Inequality: The “Wild Ride” at the Top and the Bottom. Economic Inquiry. Vol. 52, No. 1. p. 459–476.
- 98Board of Governors of the Federal Reserve System. 2020. Report on the Economic Well-Being of U.S. Households in 2019–May 2020. Income. Table 6.
- 99Gennetian, Lisa A., Sharon Wolf, Heather D. Hill, and Pamela A. Morris. 2015. Intrayear Household Income Dynamics and Adolescent School Behavior. Demography. Apr;52(2):455-83. doi: 10.1007/s13524-015-0370-9. PMID: 25735265.
- 100
- 10183 Charts to Describe the Hidden Financial Lives of Working Americans. Chart 2.4. These data do not include income shocks from tax refunds or credits.
- 102
- 103Board of Governors of the Federal Reserve System. 2020. Report on the Economic Well-Being of U.S. Households in 2019–May 2020. Banking and Credit. Table 12.
Income Volatility
The last component of economic insecurity is income volatility: month-to-month or year-to-year fluctuations in income.95The Financial Diaries Project and The Fragile Families and Child Wellbeing Study delve into income instability, and Jonathan Morduch, Kathryn Edin, and Katherine Newman have all contributed extensively to this literature. A number of studies have documented the increase in income volatility in the U.S. over the past four decades.96In income volatility literature, “permanent” and “transitory” shocks to income are frequently discussed. The former describes a shock with a “long-lasting effect which does not go away, even partially,” and the latter, a shock that affects earnings over a short period of time but does not permanently impact one’s future earning trajectory. While permanent negative shocks are more harmful, transitory negative shocks can be extremely difficult for households to manage as well. “Gross volatility” encompasses both permanent and transitory shocks.Moffit and Zhang 2018 “find that both gross volatility [of male income] and the component consisting of only the variance of transitory shocks have experienced a large increase during the Great Recession after following similar trends to those previously established showing upward trends from the 1970s to the 1980s followed by a stable period until the Recession.” Last, Western et al. 2016 find that large income losses have become more common than large income gains for low-income children between the mid-1990s and 2010. Moffit and Zhang provide an extensive overview of existing literature on income volatility in Tables 1–3 on pages 43–48. One study estimates that between 1980 and 2009, volatility in family income doubled. The increase in volatility was most stark at the top 1 percent of the income distribution, though income volatility for the bottom 10 percent of earners exceeded that of the top in any given year. Figure 9, pulled from that study, shows this increasing trend broken down by married families, female-headed families, Black families, and White families by graphing the variance in income.97Hardy, Bradley and James P. Ziliak. 2014. Decomposing Trends in Income Inequality: The “Wild Ride” at the Top and the Bottom. Economic Inquiry. Vol. 52, No. 1. p. 459–476. While income volatility is increasing across the board, Black families and female-headed families have consistently faced the least stable incomes.
Figure 9. Trends in Disposable Income by Race and Family Structure, 1981–2009
This volatility in income, which can also be thought of as income unpredictability, is not without consequences. The Federal Reserve estimates that 10 percent of households experience hardship related to unstable income.98Board of Governors of the Federal Reserve System. 2020. Report on the Economic Well-Being of U.S. Households in 2019–May 2020. Income. Table 6. Further, household income instability reduces engagement at school among adolescents and helps predict “adolescent expulsions and suspensions, particularly among low-income, older, and racial minority adolescents.”99Gennetian, Lisa A., Sharon Wolf, Heather D. Hill, and Pamela A. Morris. 2015. Intrayear Household Income Dynamics and Adolescent School Behavior. Demography. Apr;52(2):455-83. doi: 10.1007/s13524-015-0370-9. PMID: 25735265.
The U.S. Financial Diaries100See U.S. Financial Diaries. project was designed to take a close look at the extent of income volatility among households and how families try to cope with these changes in income. The project tracked the finances of 235 low- and moderate-income households (which they define relative to the federal poverty line, area median incomes, and the Supplemental Poverty Measure) during the period July 2012 through June 2013 to study how U.S. households experience volatility and insecurity. The project found that three out of four households saw income vary by at least 22 percent month to month. A third of those households (25 percent of the total studied) had monthly incomes varying by over 48 percent.10183 Charts to Describe the Hidden Financial Lives of Working Americans. Chart 2.4. These data do not include income shocks from tax refunds or credits. These swings are large. At 22 percent variance, a family with $2,000 in income in one month can expect an income somewhere between $1,600 and $2,400 the following month. That $800 swing is difficult to plan around in both the short term (such as meeting exigencies like buying food or paying rent) or in the medium or long term (such as saving for a house or retirement).
The Financial Diaries Project also confirmed how little cushion most families had. The average “emergency savings” of the families included in the project was $1,788, but the median emergency savings was $55—and 45 percent of households had no emergency savings at all.10283 Charts to Describe the Hidden Financial Lives of Working Americans. Charts 4.1–4.2.
The lack of predictability in income—especially for those who do not have savings—is at the heart of economic insecurity. Households cannot be expected to plan for shocks like job loss and the death of a breadwinner when they cannot reliably plan how they will meet short-term costs of living.
The ability to maintain one’s income level in the face of unpredictable changes or unstable sources can be aided through access to credit and banking. Taking the example of the $2,000 monthly income that has a 50 percent chance of being $400 higher or lower in a given month: In theory, $1,600 in a month may be insufficient to pay for all necessary expenses, but a credit card can fill in the difference and can be paid off during a $2,400 month. However, given the unpredictability of volatility, it is difficult in practice to know whether an accrued debt can be paid off in the future.
In addition, access to credit is not universal. As a parallel to having less access to banks, Black individuals also have a more difficult time obtaining credit. When looking at credit application denials in groups of individuals with similar incomes, Black individuals had more credit denials than White individuals or Hispanic individuals, by a factor of two or three.103Board of Governors of the Federal Reserve System. 2020. Report on the Economic Well-Being of U.S. Households in 2019–May 2020. Banking and Credit. Table 12.
Table 5. Credit Applicants with Adverse Outcomes, 2019
| Family Income and Race |
Denied | Denied or Approved for Less than Requested |
| Less than $40,000 | ||
| White | 40 | 48 |
| Black | 58 | 68 |
| Hispanic | 41 | 49 |
| Overall | 43 | 51 |
| $40,000 – $100,000 | ||
| White | 17 | 22 |
| Black | 41 | 57 |
| Hispanic | 30 | 39 |
| Overall | 22 | 29 |
| Greater than $100,000 | ||
| White | 7 | 10 |
| Black | 19 | 31 |
| Hispanic | 17 | 22 |
| Overall | 9 | 13 |
| All incomes | ||
| White | 19 | 24 |
| Black | 44 | 57 |
| Hispanic | 32 | 40 |
| Overall | 24 | 31 |
Income volatility is increasing and presents a hardship for many families. Without stable or reliable incomes, it can be difficult to establish a base of economic security.
- 95The Financial Diaries Project and The Fragile Families and Child Wellbeing Study delve into income instability, and Jonathan Morduch, Kathryn Edin, and Katherine Newman have all contributed extensively to this literature.
- 96In income volatility literature, “permanent” and “transitory” shocks to income are frequently discussed. The former describes a shock with a “long-lasting effect which does not go away, even partially,” and the latter, a shock that affects earnings over a short period of time but does not permanently impact one’s future earning trajectory. While permanent negative shocks are more harmful, transitory negative shocks can be extremely difficult for households to manage as well. “Gross volatility” encompasses both permanent and transitory shocks.Moffit and Zhang 2018 “find that both gross volatility [of male income] and the component consisting of only the variance of transitory shocks have experienced a large increase during the Great Recession after following similar trends to those previously established showing upward trends from the 1970s to the 1980s followed by a stable period until the Recession.” Last, Western et al. 2016 find that large income losses have become more common than large income gains for low-income children between the mid-1990s and 2010. Moffit and Zhang provide an extensive overview of existing literature on income volatility in Tables 1–3 on pages 43–48.
- 97Hardy, Bradley and James P. Ziliak. 2014. Decomposing Trends in Income Inequality: The “Wild Ride” at the Top and the Bottom. Economic Inquiry. Vol. 52, No. 1. p. 459–476.
- 98Board of Governors of the Federal Reserve System. 2020. Report on the Economic Well-Being of U.S. Households in 2019–May 2020. Income. Table 6.
- 99Gennetian, Lisa A., Sharon Wolf, Heather D. Hill, and Pamela A. Morris. 2015. Intrayear Household Income Dynamics and Adolescent School Behavior. Demography. Apr;52(2):455-83. doi: 10.1007/s13524-015-0370-9. PMID: 25735265.
- 100
- 10183 Charts to Describe the Hidden Financial Lives of Working Americans. Chart 2.4. These data do not include income shocks from tax refunds or credits.
- 102
- 103Board of Governors of the Federal Reserve System. 2020. Report on the Economic Well-Being of U.S. Households in 2019–May 2020. Banking and Credit. Table 12.