For Immediate Release | October 5, 2017
WASHINGTON, D.C. – The growth rates of total workers’ compensation benefits paid and employer costs declined in California in recent years, according to a new report from the National Academy of Social Insurance (the Academy).
In 2015, workers’ compensation benefits paid in California were $12.1 billion. Between 2011 and 2015, total benefits paid increased 11.2 percent. However, that growth occurred primarily between 2011 and 2013; benefits increased 11.6 percent from 2011 to 2013, but declined 0.4 percent from 2013 to 2015. The decline in total benefits paid in recent years brings trends in California closer to those occurring in the rest of the nation.
The decline in total benefits paid in California was driven by reductions in medical spending. Between 2011 and 2015, medical benefits increased 7.5 percent, but between 2013 and 2015, they declined by 3.7 percent. Wage-replacement cash benefits increased 16.3 percent over the five-year period.
“California Senate Bill 863, which took effect in 2013, increased permanent disability benefits to injured workers and improved the medical delivery system,” said Christine Baker, Director of the California Department of Industrial Relations. “These reforms also included cost-saving efficiencies to employers that will shape workers’ compensation benefits and costs in our state in the coming years.”
As a result of the decline in medical spending, the share of medical benefits fell from 58.0 percent of total benefits paid in 2011 to 56.1 percent in 2015. Compared to the rest of the nation, California had the 23rd highest percentage share of medical benefits relative to total benefits paid in 2015.
In 2015, workers’ compensation employer costs in California were $19.4 billion. Between 2011 and 2015, costs in California increased 40.5 percent, well above the average increase for the rest of the U.S. (16.2 percent).
Table 1. Workers’ Compensation Benefits, Coverage, & Costs: California and the Rest of the United States
|
2015 |
Percent Change 2011 to 2015 |
|||
|
CA |
Rest of U.S. |
CA |
Rest of U.S. |
|
| Aggregate Benefits, Coverage, and Costs | ||||
| Total Benefits (billions) |
$12.1 |
$46.1 |
11.2% |
-1.5% |
|
Medical Benefits |
$6.8 |
$23.1 |
7.5% |
-1.2% |
|
Cash Benefits |
$5.3 |
$23.0 |
16.3% |
-1.9% |
| Covered Workers (thousands) |
16,051 |
116,786 |
12.2% |
7.4% |
| Covered Payroll (billions) |
$986 |
$5,987 |
25.9% |
18.2% |
| Employer Costs (billions) |
$19.4 |
$70.6 |
40.5% |
16.2% |
Workers’ compensation, the nation’s first social insurance program, pays medical benefits to the providers of health care for injured workers, and cash benefits to workers whose injuries prevent them from working. Much of the interstate variation in benefit payments and employer costs can be attributed to different trends in employment and wages across states, rather than to structural differences in state workers’ compensation systems.
“California is one of the highest employer cost states in the country,” said Frank Neuhauser, Researcher at University of California, Berkeley. “Although California’s average medical and cash benefits paid per claim are only moderately higher than the median state, administrative costs, such as those for litigation and claims management, are extraordinarily high and rising faster than any other cost component.”
Other findings on workers’ compensation in California from the Academy’s report include:
- Growth in covered employment and payroll in California continued to outpace the rest of the nation between 2011 and 2015. In 2015, covered employment reached 16.1 million in California, up 12.2 percent from 2011, and covered payroll was $986 billion, up 25.9 percent from 2011.
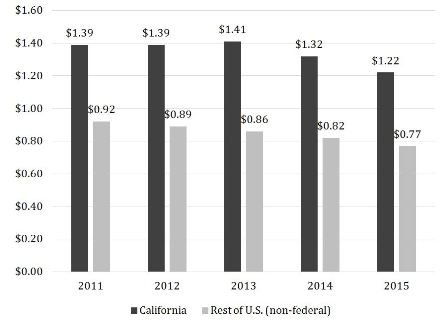
- Benefits paid in California declined to $1.22 per $100 of covered payroll in 2015, down from $1.39 in 2011 (Figure 1). All of the decline occurred between 2013 and 2015. Between 2011 and 2015, benefits as a share of payroll declined in the rest of the U.S. at a more consistent pace (from $0.92 to $0.77).
Figure 1. Workers’ Compensation Benefits per $100 of Covered Payroll, 2011-2015: California and the Rest of the U.S. (non-federal)
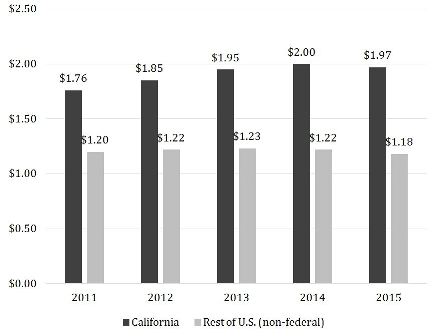
- Costs as a share of payroll in California increased between 2011 and 2015, but the growth rate slowed in recent years (Figure 2). Between 2011 and 2013, costs per $100 of payroll rose from $1.76 to $1.95; between 2013 and 2015, costs increased only from $1.95 to $1.97. Over the same period, costs as a share of payroll in the rest of the U.S. declined from $1.20 to $1.18.
Figure 2. Workers’ Compensation Costs per $100 of Covered Payroll, 2011-2015: California and the Rest of the United States (non-federal)
Workers’ Compensation: Benefits, Coverage, and Costs (2015 data) is the 20th in an annual series. The report provides the only comprehensive data on workers’ compensation benefits, coverage, and costs for the nation, the state, the District of Columbia, and federal programs.
EXPERTS TO CONTACT:
| Marjorie Baldwin Arizona State University (480) 965-7868 marjorie.baldwin@asu.edu |
Christine Baker California Department of Industrial Relations (510) 622-3962 cbaker@dir.ca.gov |
Christopher McLaren National Academy of Social Insurance (202) 243-7280 cmclaren@nasi.org |
Frank Neuhauser U.C. Berkeley (510) 643-0667 frankn@berkeley.edu |
The National Academy of Social Insurance is a non-profit, nonpartisan organization made up of the nation’s leading experts on social insurance. Its mission is to advance solutions to challenges facing the nation by increasing public understanding of how social insurance contributes to economic security.
See related news: Disability, Workers' Compensation, Workforce Issues and Employee Benefits