By: National Academy of Social Insurance
Published: September, 2021
**Updated to reflect the estimates of the 2021 Trustees Report.**
The primer is a PowerPoint presentation of approximately 40 slides that provides factual background about Social Security, its benefits and finances, and some policy options to improve the program. The Academy’s income security staff ensures that the data in the presentation are up-to-date.
Topics covered include:
- Who receives Social Security? What are typical Social Security benefits? How do benefits compare to earnings for retirees at different wage levels?
- Who pays for it?
- How many older Americans receive employer-sponsored pensions?
- How are Social Security retirement benefits projected to change in the future?
- What is Social Security disability insurance?
- What are the “best estimate” long-range projections of Social Security finances? What do the high-cost and low-cost projections show? What is the actuarial deficit?
- Why will Social Security cost more in the future? Can we afford Social Security in the future? How can we strengthen Social Security in the future? What are our options? Why consider revenue enhancements to balance Social Security?
- What do American workers say?
Users can download the PowerPoint presentation and sort the slides in a different order or pick and choose a subset to use. The presentation includes talking points that go with each slide. To view the talking points, simply go to View > Notes Page. The sources for the factual material are listed on each slide.
The PDF versions include both the slides and the notes pages that go with them on the same page.
What is Social Security?
The Financial Outlook
Can We Afford Social Security in the Future?
Strengthening Social Security
What is Social Security?
How Many People Receive Social Security?
-
- More than 65 million people receive Social Security each month, in one of three categories:
- Retirement insurance
- Survivors insurance
- Disability insurance
- More than 65 million people receive Social Security each month, in one of three categories:
- Over 1 in 5 Americans gets Social Security benefits.
- About 1 in 4 families receives income from Social Security.
Social Security Administration (SSA), 2021a; National Academy of Social Insurance, 2020.
Who Receives Social Security?
- 46.9 million retired workers
- 8.0 million disabled workers
- 3.9 million widows and widowers
- 2.3 million spouses
- 1.1 million adults disabled since childhood
- 2.7 million children
SSA, 2021a.
How Much Does Social Security Pay? (December 2020)
|
By Beneficiary Type: |
Average Monthly Benefit |
Average Yearly Benefit |
|
Retired workers |
$1,544 |
$18,530 |
|
Disabled workers |
$1,277 |
$15,325 |
|
Widows or widowers (60 or older) |
$1,455 |
$17,466 |
|
By Family Type: |
Average Monthly Benefit for Family |
Average Yearly Benefit for Family |
|
Retired worker and spouse (62 or older) |
$2,582 |
$30,989 |
|
Widowed mother or father (under 60) and two children |
$2,962 |
$35,547 |
|
Disabled worker and one or more children |
$1,979 |
$23,748 |
* The most recent month-level data presented in SSA’s “Benefits Paid by Type of Family” database as of 9/1/2021 is for December 2020.
SSA, 2021a; SSA, 2021b.
How Do Benefits Compare to Earnings?
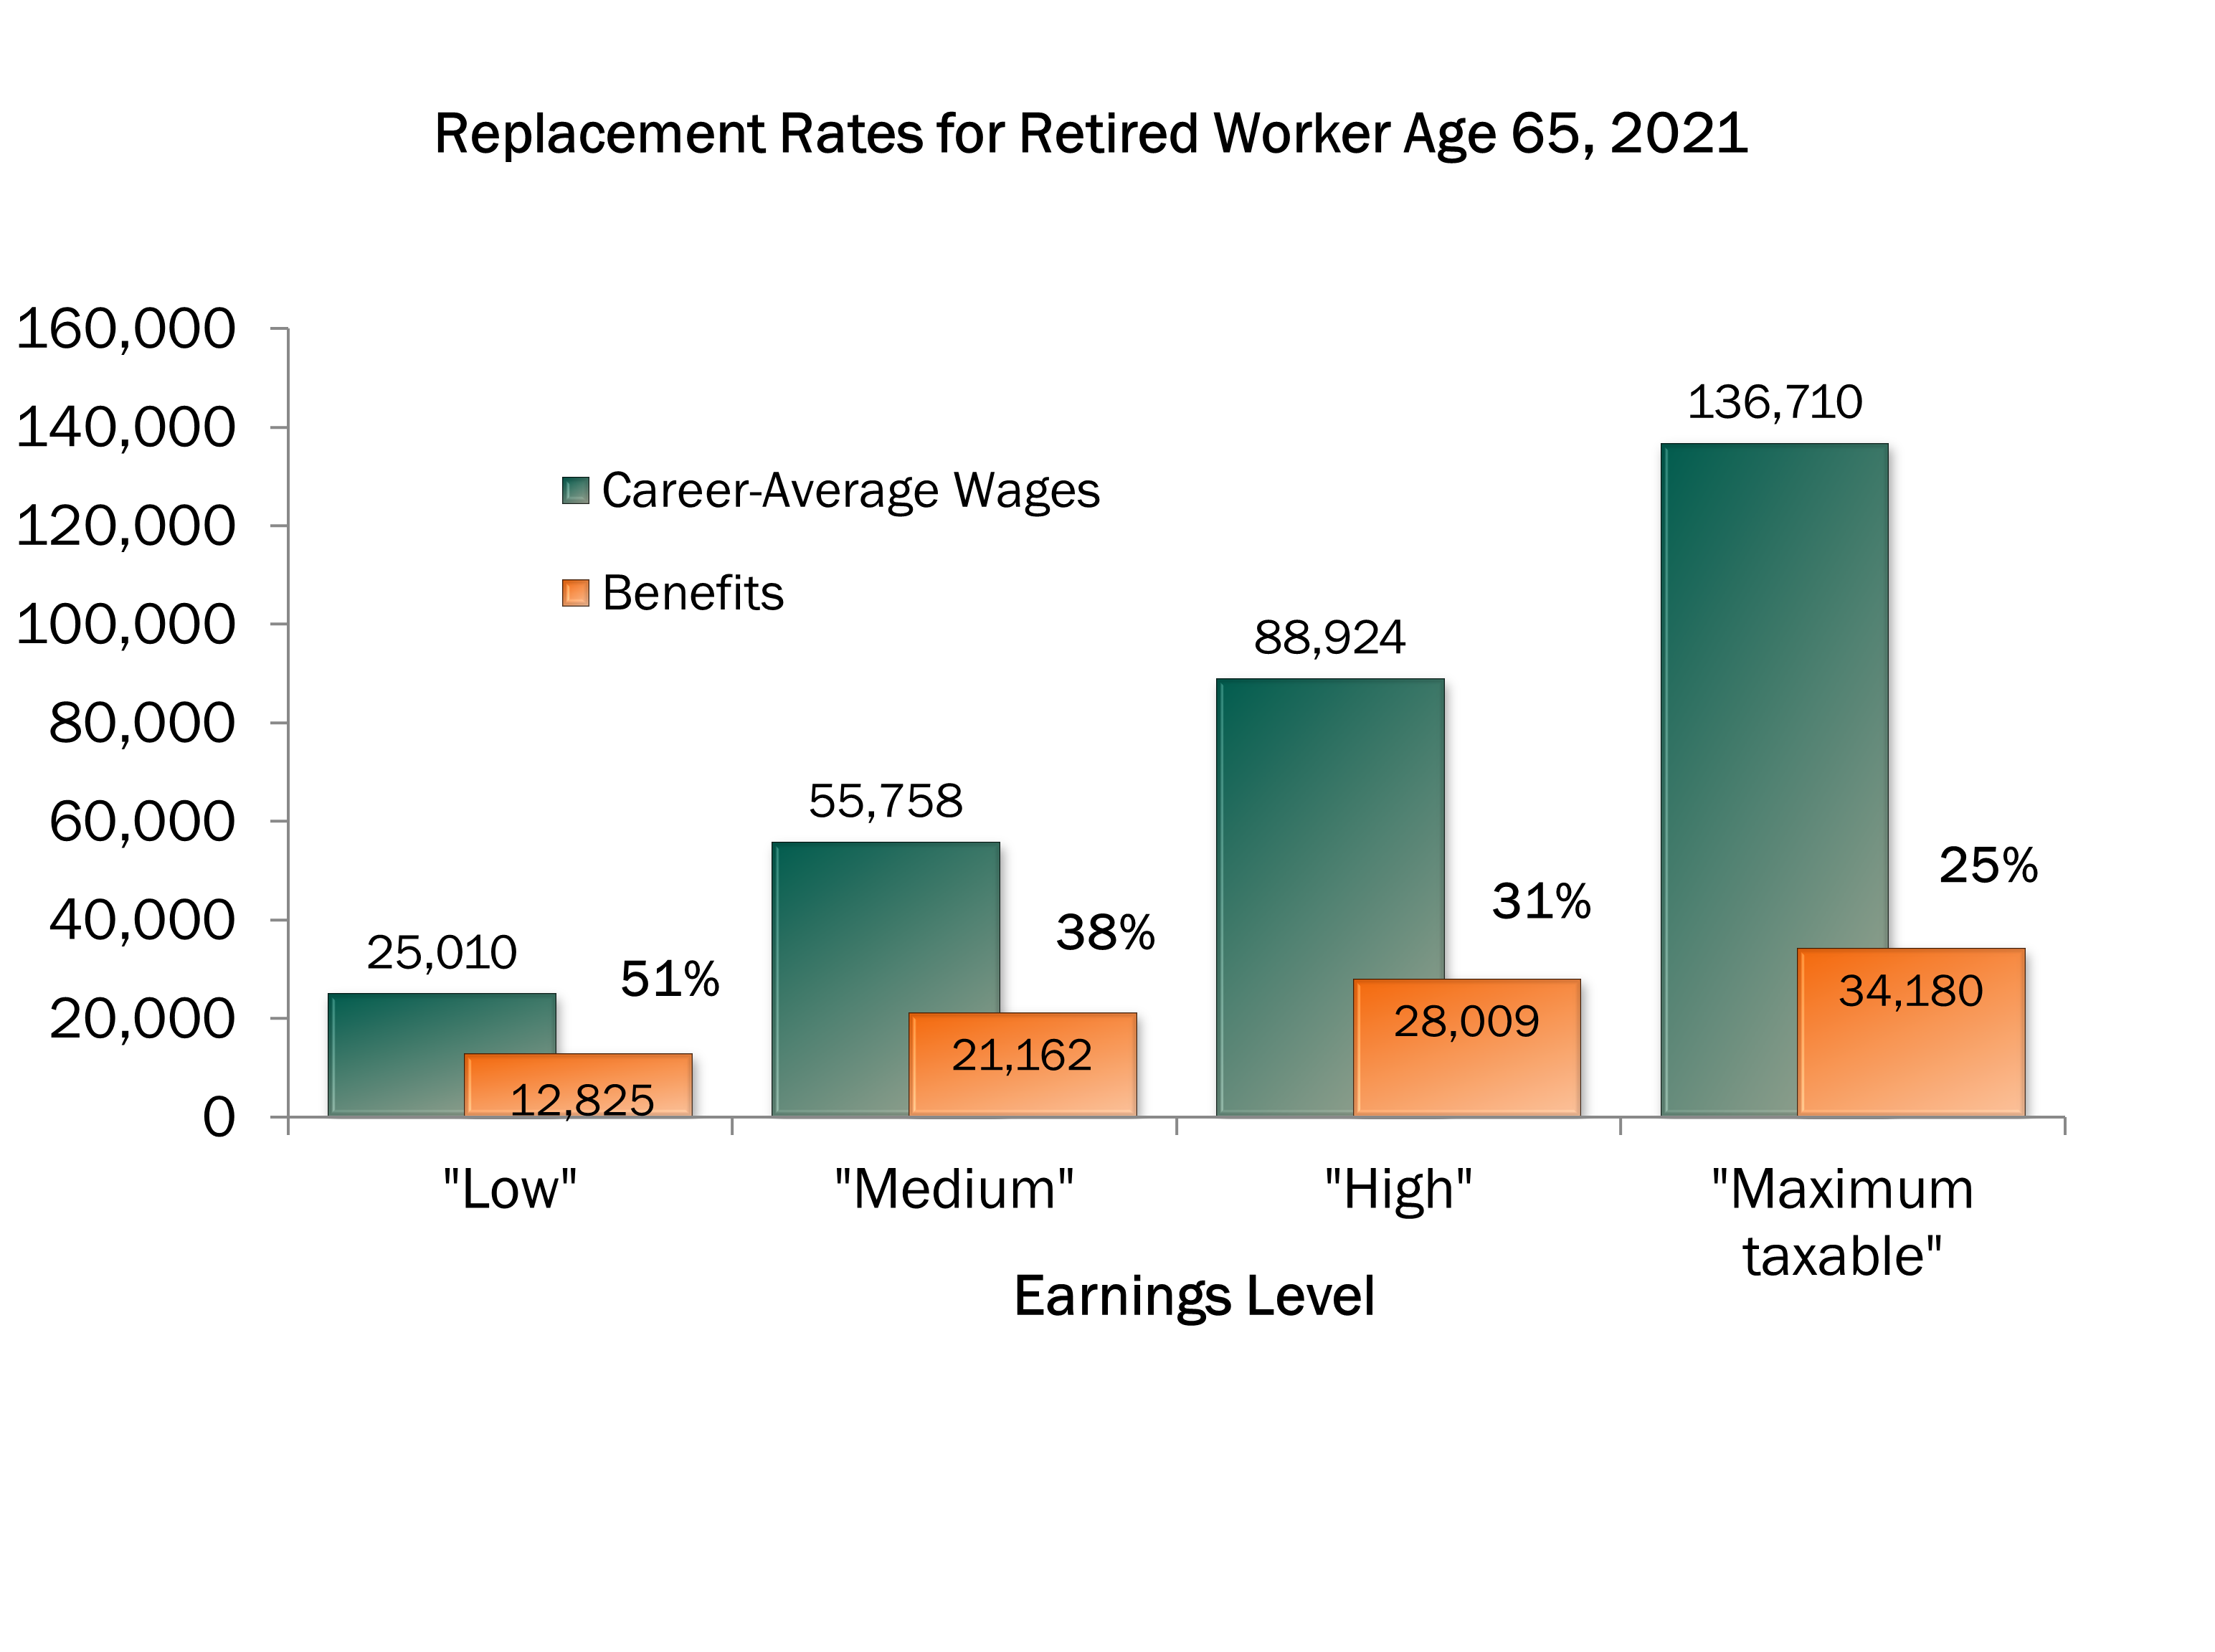
SSA, 2021c.
How Many Seniors Rely on Social Security for Most of Their Income?
- Nearly nine out of ten individuals age 65 and older receive Social Security.
- Among elderly beneficiaries, 50% of married couples and 70% of unmarried individuals receive half or more of their income from Social Security.*
- Among elderly beneficiaries, 21% of married couples and 45% of unmarried individuals receive almost all (90% or more) of their income from Social Security.*
*Some evidence indicates that a somewhat lower proportion of beneficiaries, about half, receive half or more of their total income from Social Security, and about 20% may get 90% or more of their income from Social Security (Bee and Mitchell, 2017). This is supported by a 2021 paper which, using IRS data, estimates that about 40% of individuals aged 65 and older receive at least 50% of income from Social Security, 21% receive at least 75% of income, and 14% receive at least 90% of income (Dushi and Trenkamp, 2021).
Reliance on Social Security By Race
| Percent of beneficiary households 65 or older whose Social Security benefits make up: | ||
| Race: | Half or more
of their income |
90% or more
of their income |
| White | 60% | 32% |
| Black | 69% | 45% |
| Asian | 62% | 41% |
| Hispanic | 73% | 52% |
*From SSA, on this data:
“In earlier years, 12 of this section’s 20 tables included breakdowns by race. The availability of the race data and the definitions of the race categories varied over time. These concerns about data quality and consistency led to the removal of race breakdowns from this section beginning in the 2011 Annual Statistical Supplement. Although the data quality issues are not yet resolved, Excel versions of those 12 tables are available with the race breakdowns restored. Users are advised to interpret data by race with caution. For more information, see https://www.ssa.gov/policy/docs/rsnotes/rsn2016-01.html.”
Reliance on Social Security By Gender and Family Type
| Percent of beneficiaries 65 or older whose Social Security benefits make up: | ||
| By Gender: | Half or more of their income | 90% or more of their income |
| Unmarried women | 61% | 34% |
| Unmarried men | 56% | 29% |
| Percent of beneficiary households 65 or older whose Social Security benefits make up: | ||
| By Family Type: | Half or more of their income | 90% or more of their income |
| Married couples | 48% | 21% |
| Unmarried people | 71% | 43% |
SSA, 2016: Tables 9.A2 and 9.B3.
Increase in Full Retirement Age (FRA) Lowers Retirement Benefits at Any Age Claimed
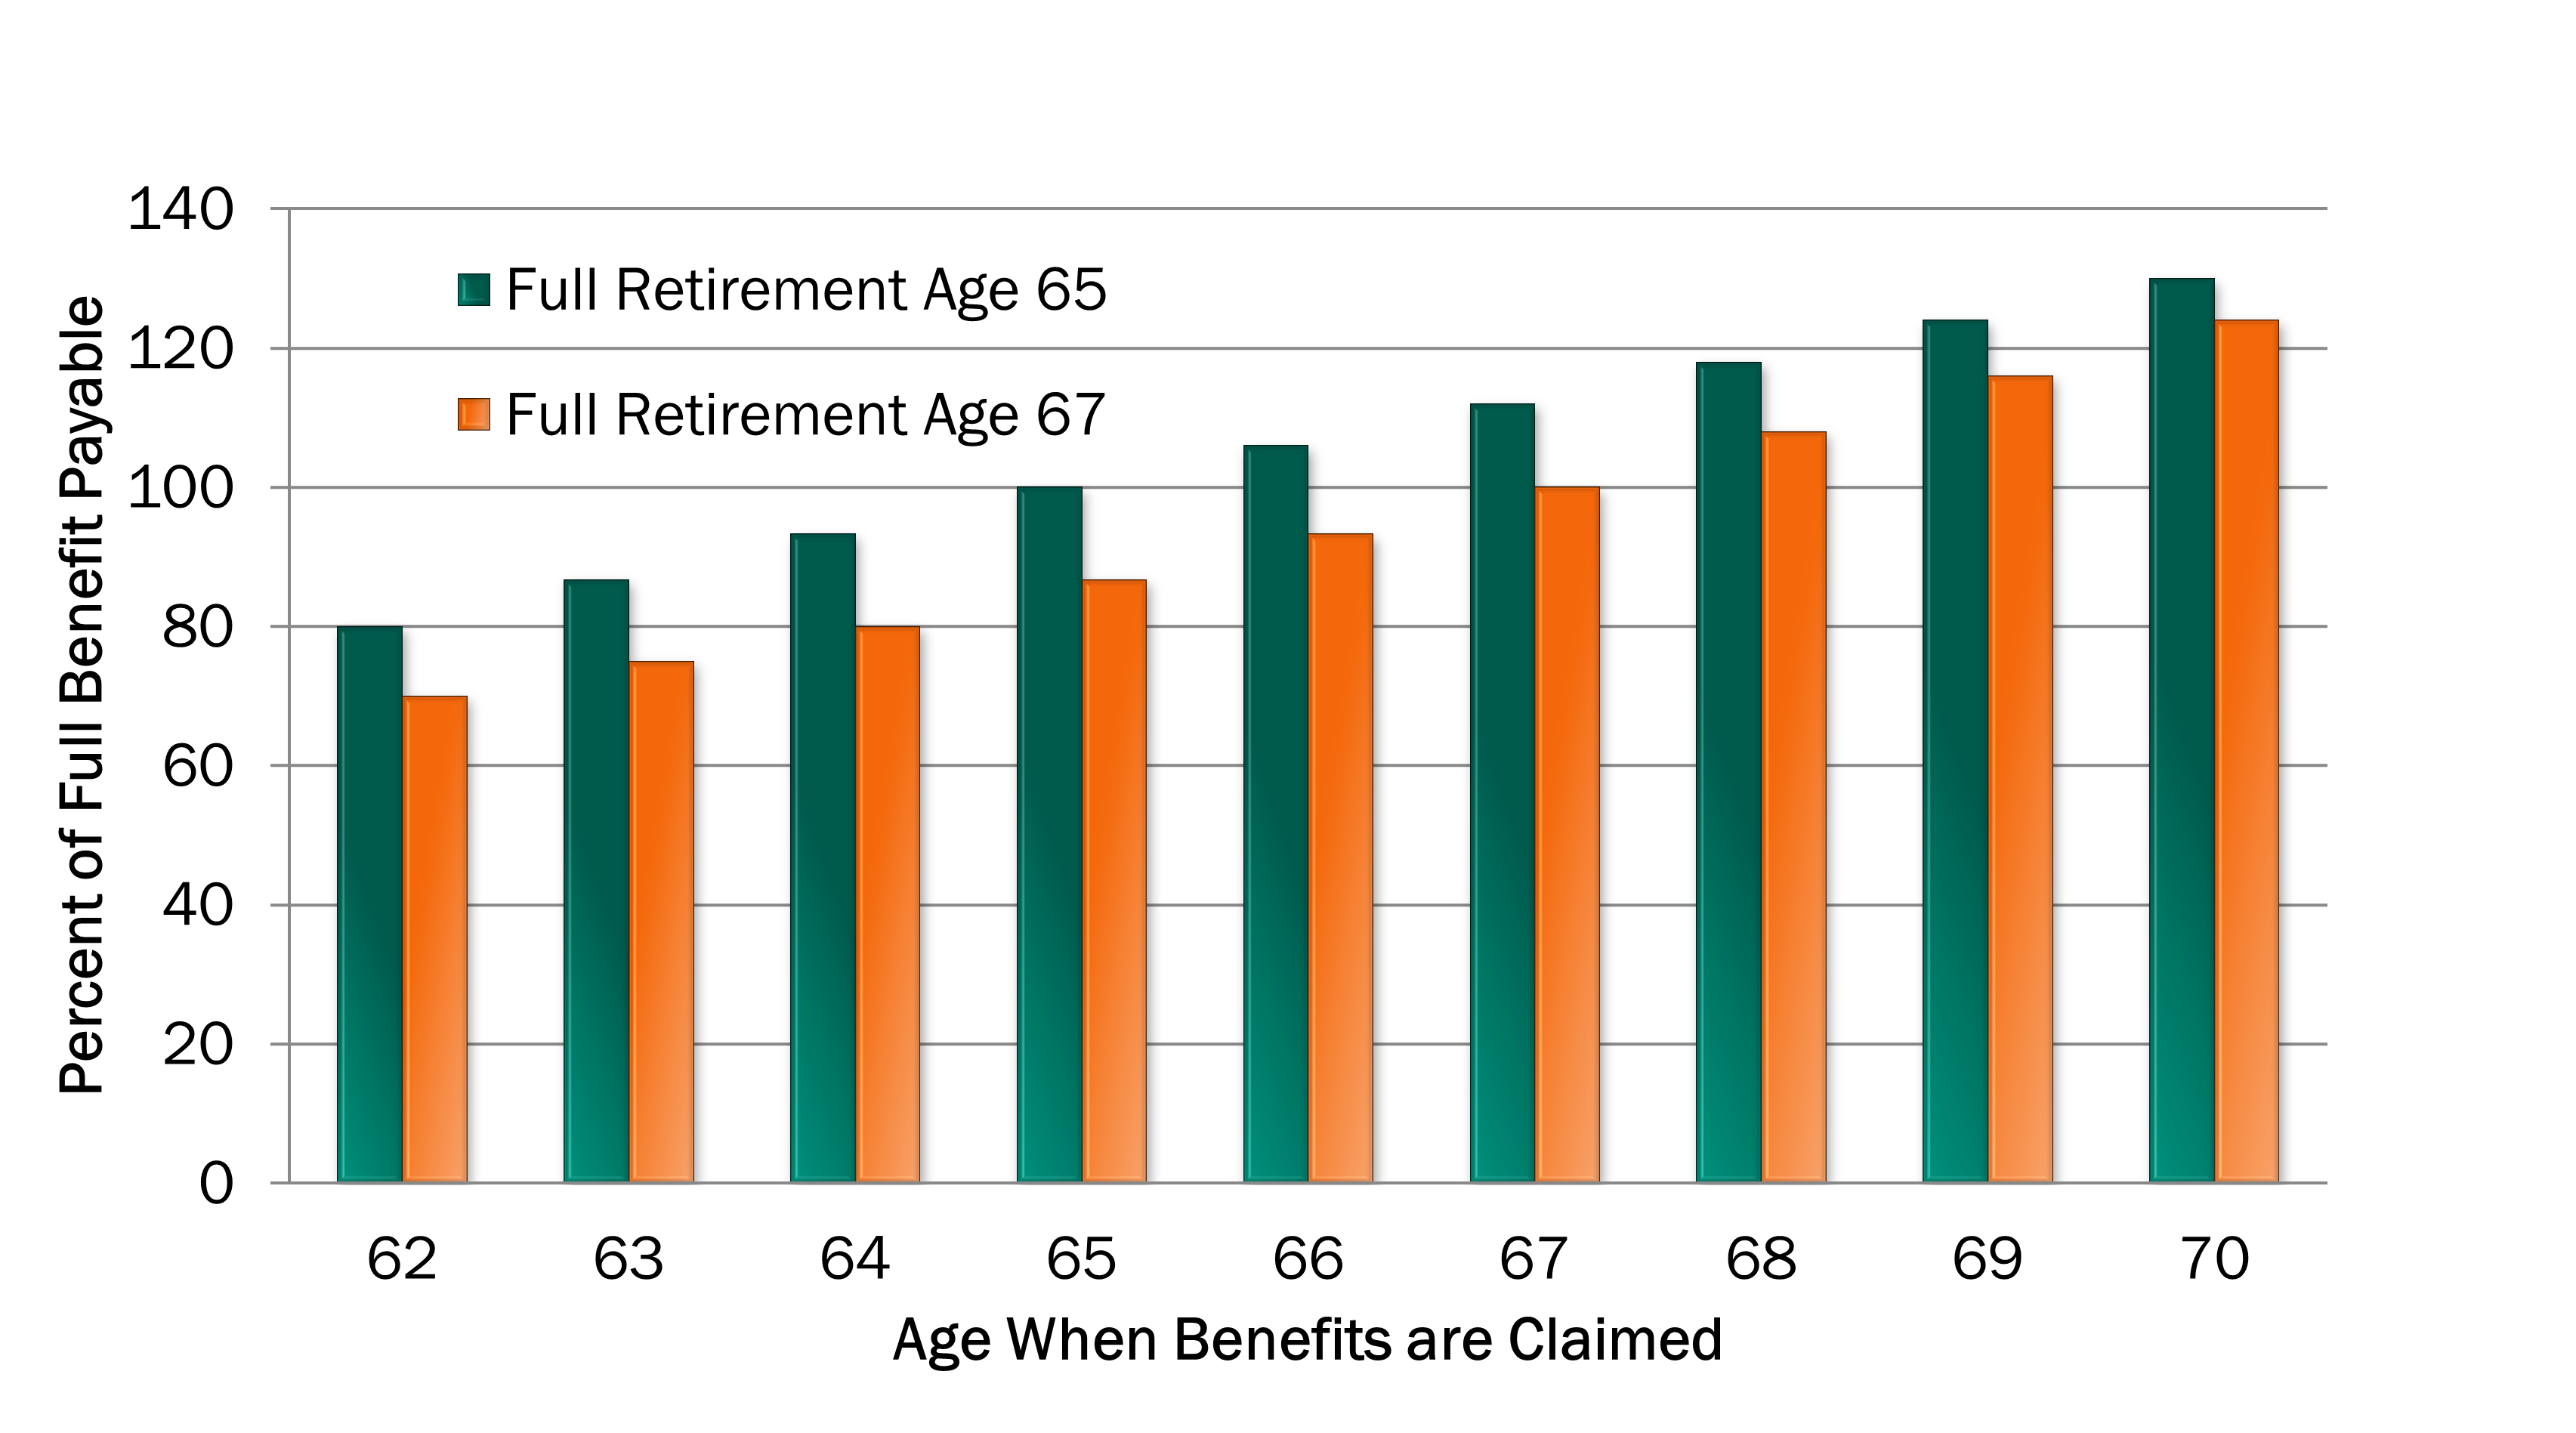
Gregory et al., 2010.
Net Social Security Replacement Rates Will Fall
Medium Earner’s Replacement Rate at 65 (after Medicare Parts B & D premiums and taxation of benefits)
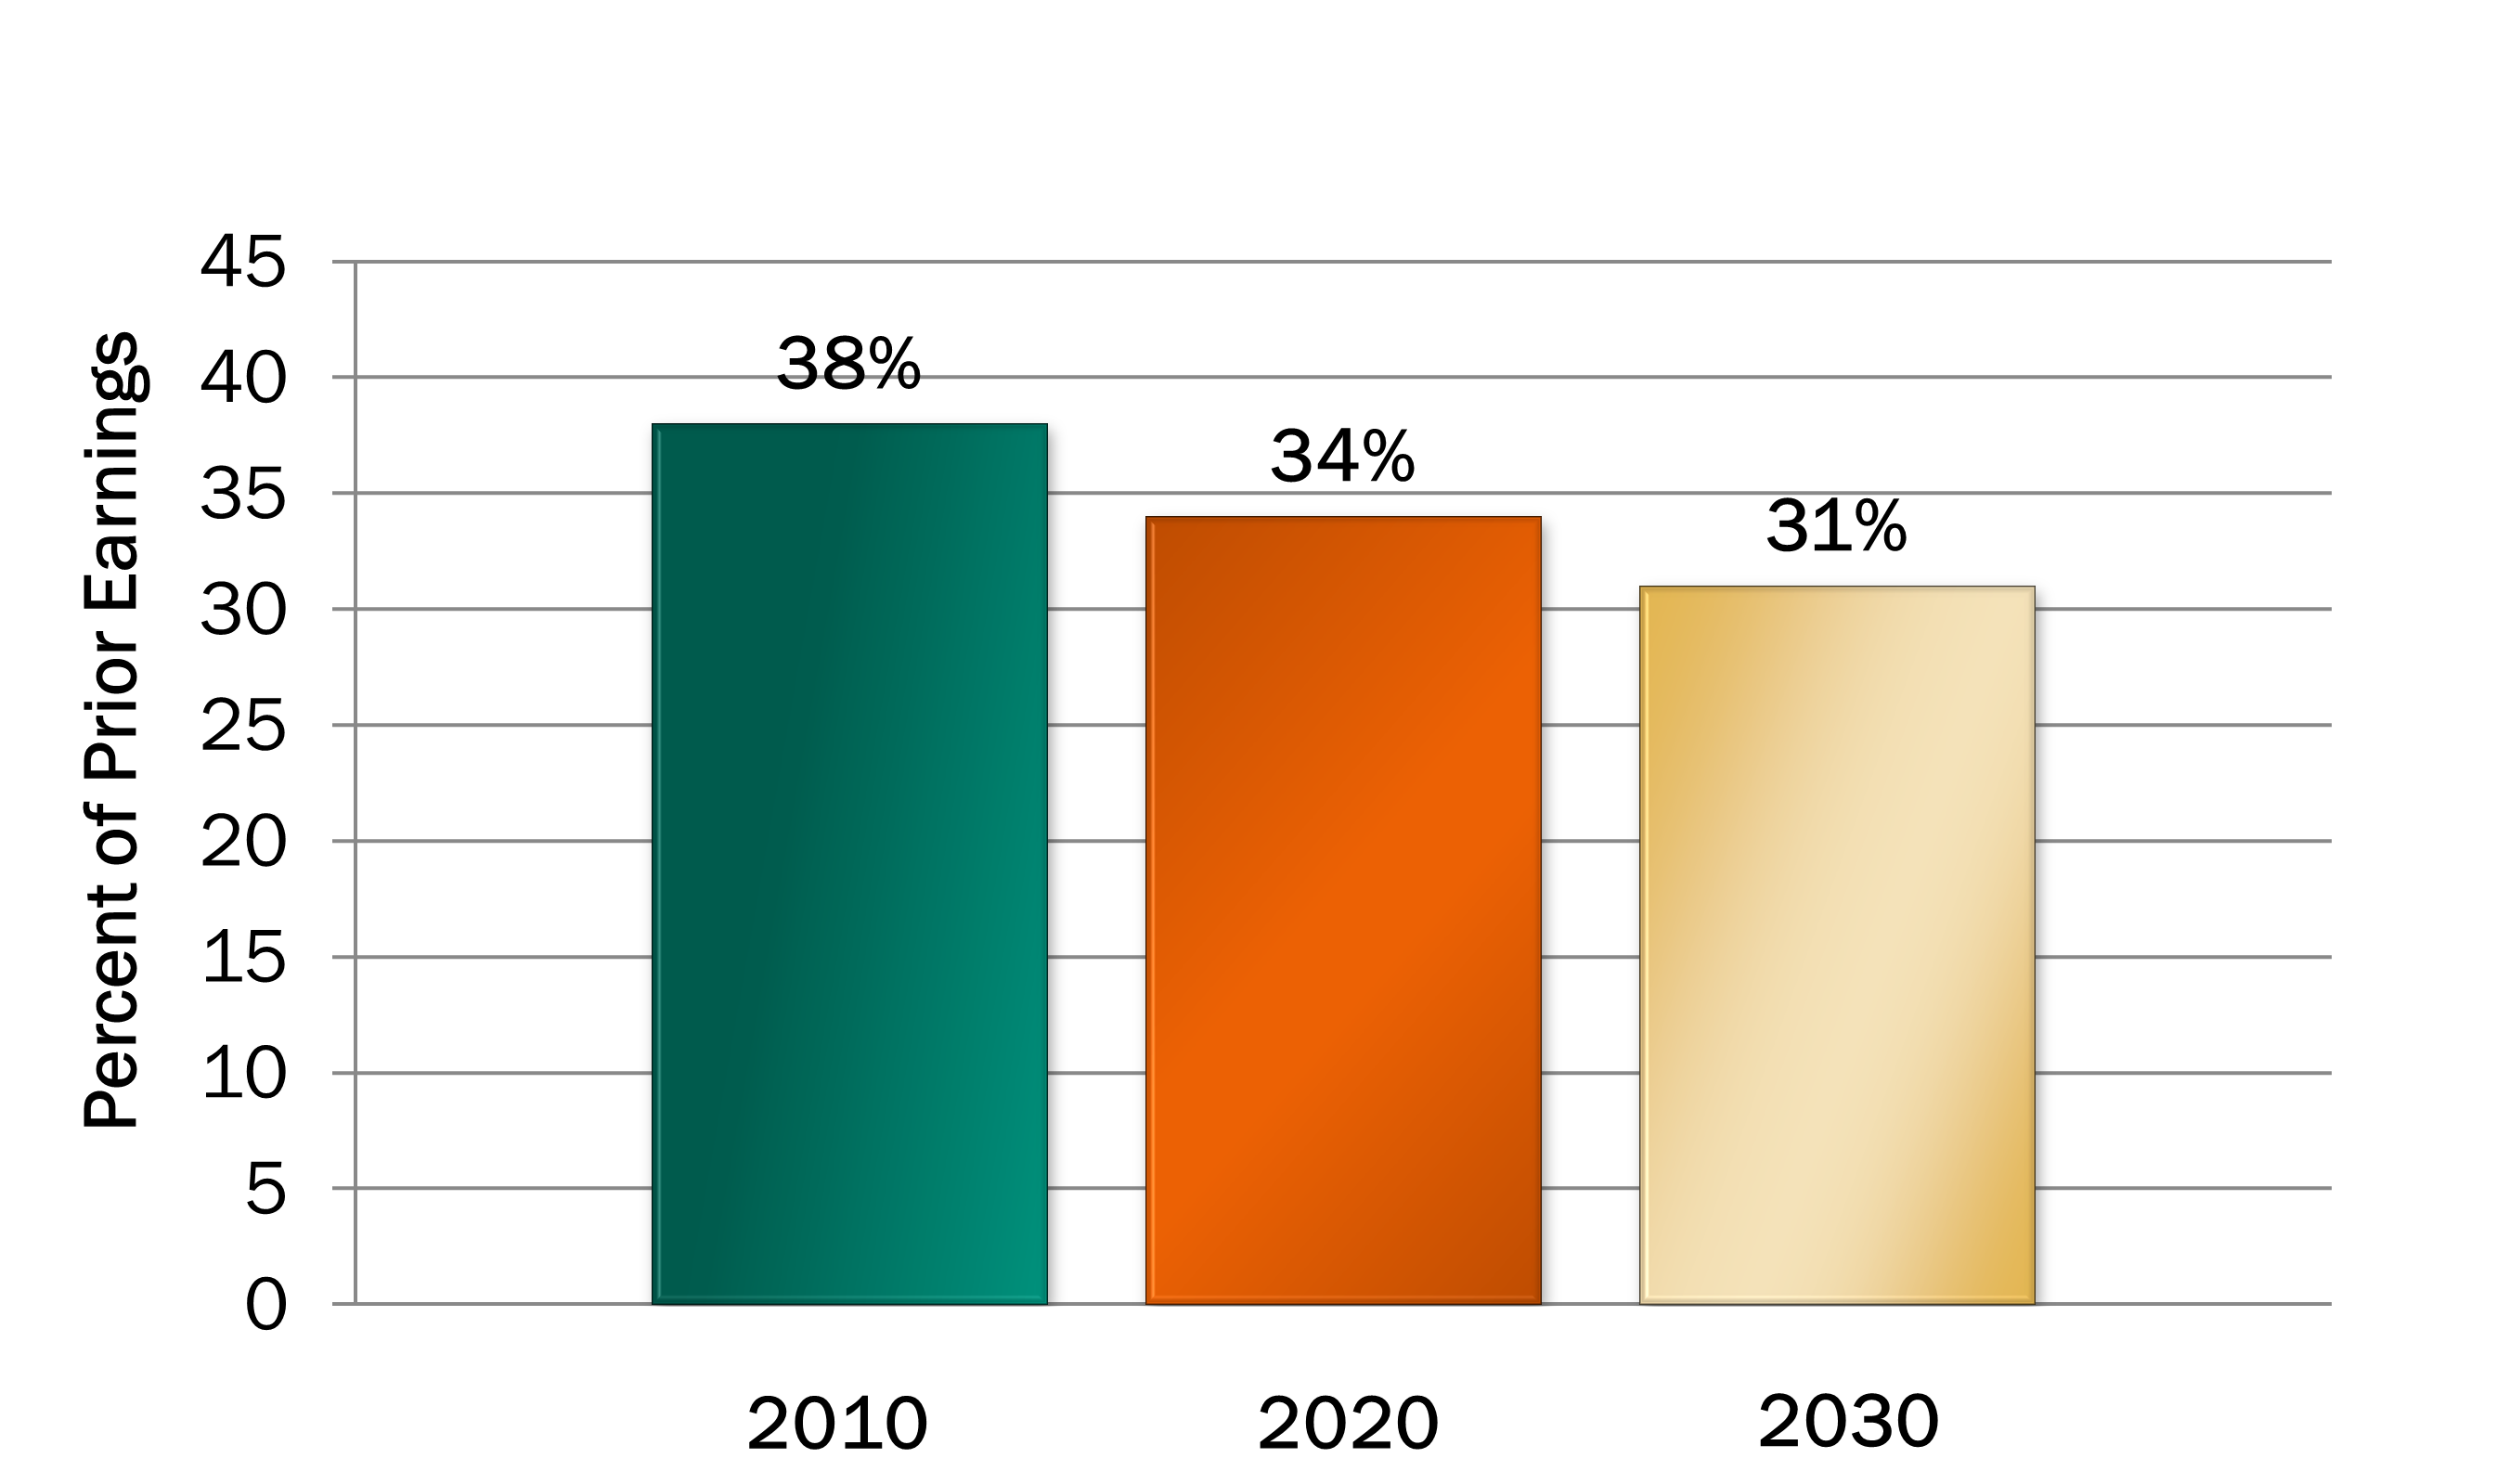
Munnell, 2013.
What is Social Security Disability Insurance?
- Disability Insurance (DI) pays monthly benefits to 8.0 million workers who are no longer able to work due to illness or impairment.
- It is part of the Social Security program.
- Benefits are based on the disabled worker’s past earnings.
- To be eligible, a disabled worker must have worked in jobs covered by Social Security.
What are the Most Common Disabilities for DI Recipients?
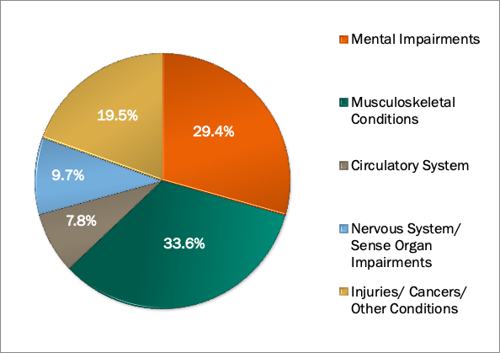
SSA, 2020: Table 21
Attributes of Disabled-Worker Beneficiaries
- 3 in 10 disabled workers have incomes below 125% of the poverty threshold.
- Disabled worker beneficiaries are more likely than other adults to be:
- older (65% are over 50);
- African-American;
- and have a lower educational attainment:
- almost half have a high school diploma or less;
- 10% did not finish high school.
Bailey and Hemmeter, 2015
Who Pays for Social Security?
- Workers and their employers pay with Social Security contributions under the Federal Insurance Contributions Act (FICA).
How Much Do Workers and Employers Pay?
- Workers contribute 6.2% of their earnings for Social Security.
- Employers match these worker contributions (6.2%).
- The total Social Security contribution is 12.4%.
- Earnings above $142,800 are exempt from Social Security contributions.
Board of Trustees, 2021. Table V.C1.
Where Does the Money Go?
- It is credited to the Social Security trust funds. Of the 6.2% tax rate:
- 5.3% goes to the retirement and survivor insurance fund
- 0.9% goes to the disability insurance fund
- Projections of income and outgo of the Trust Funds are made by the Social Security Administration actuaries.
Board of Trustees, 2021: Table II.B2.
The Financial Outlook
2020 Finances
Trust Fund income = $1118.1 billion
Trust Fund outgo = $1107.2 billion
____________
Increase in Trust
Fund reserves = $10.9 billion
- By law, surpluses are invested in U.S. Treasury securities and earn interest that goes to the Trust Funds.
Board of Trustees, 2021: Table IV.A3.
Where is Social Security Income From?
Shares of Income to the Trust Funds, 2020
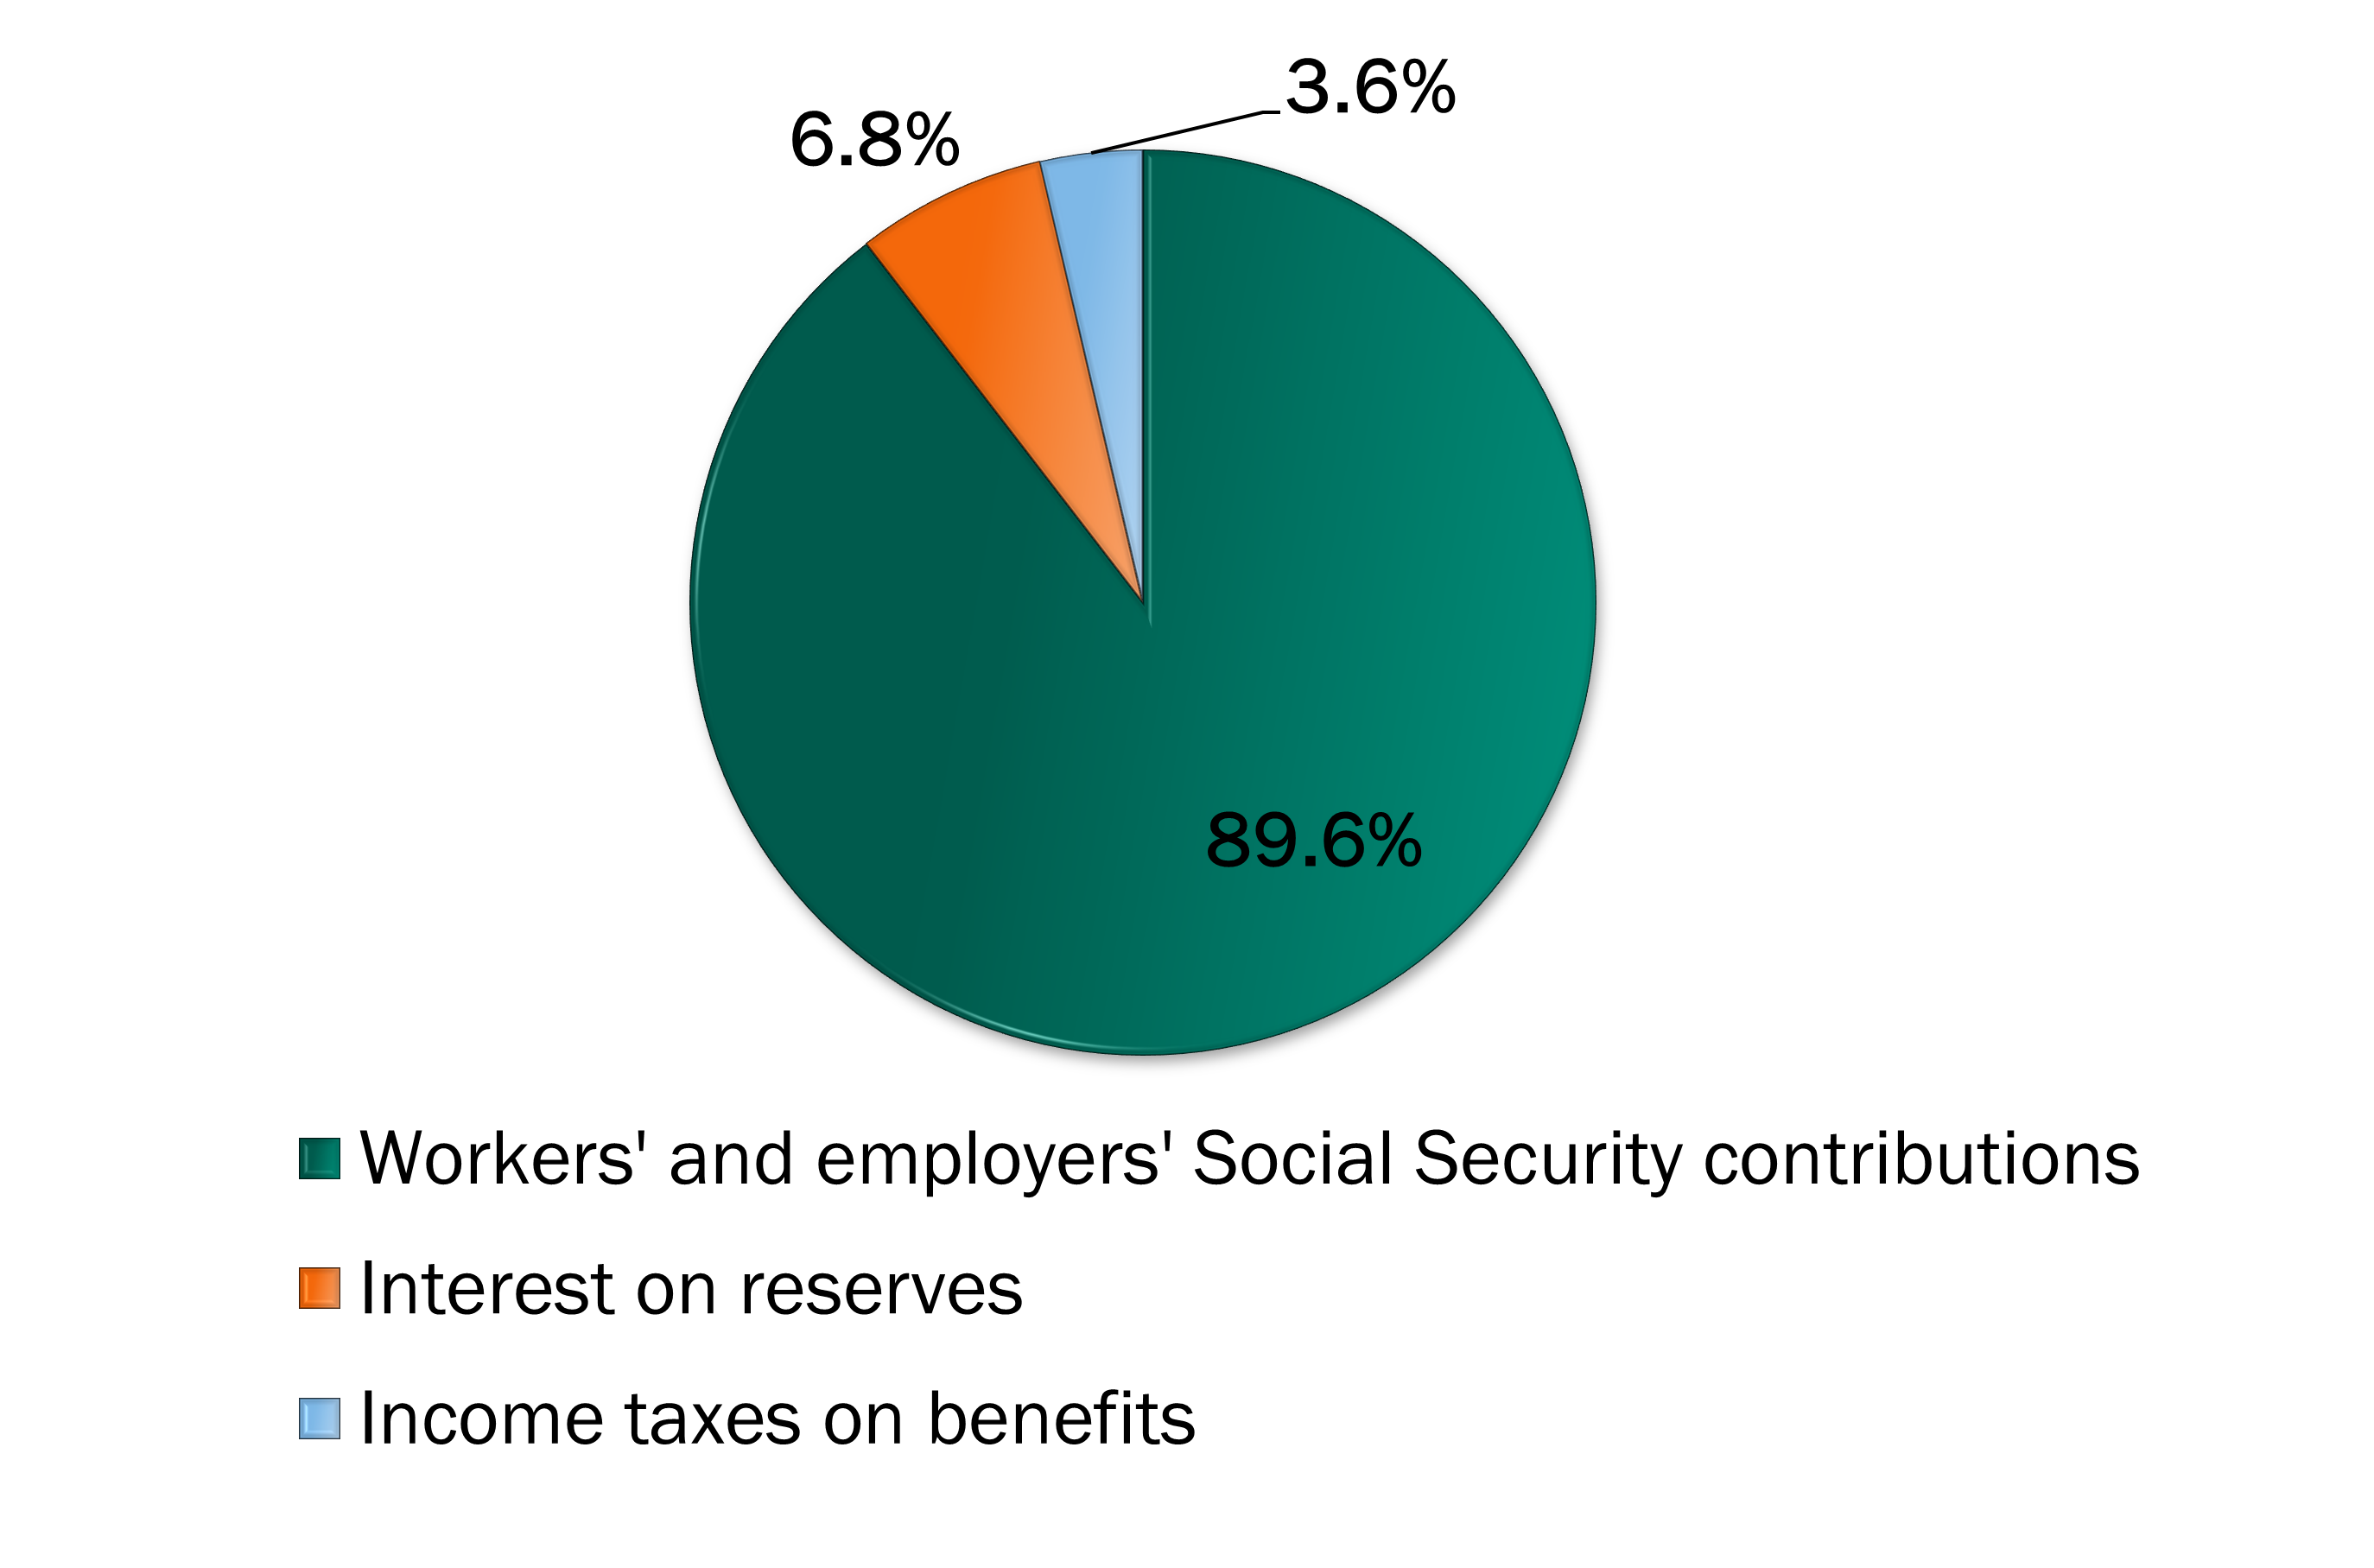
Board of Trustees, 2021: Table IV.A3.
What are Social Security Reserves, or Assets?
- Social Security income that is not used immediately to pay benefits and costs is invested in special-issue Treasury securities (or bonds).
- The bonds earn interest that is credited to the trust funds.
- The accumulated surpluses held in Treasury securities are called Social Security reserves, or trust fund assets.
- The Treasury securities are secure investments that are backed by the full faith and credit of the United States government.
Disability Insurance Projections
- By law, Social Security has two separate Trust Funds:
- Disability Insurance (DI) Trust Fund
- Old-Age and Survivors Insurance (OASI) Trust Fund
- With the Bipartisan Budget Act of 2015, Congress temporarily rebalanced the distribution of Social Security payroll contributions between OASI and DI, extending solvency of the DI Trust Fund.
- According to the 2021 Social Security Trustees Report, the DI Trust Fund is projected to be able to pay full benefits until 2057.
Board of Trustees, 2021: p.4.
How Large are Social Security Trust Fund Assets?
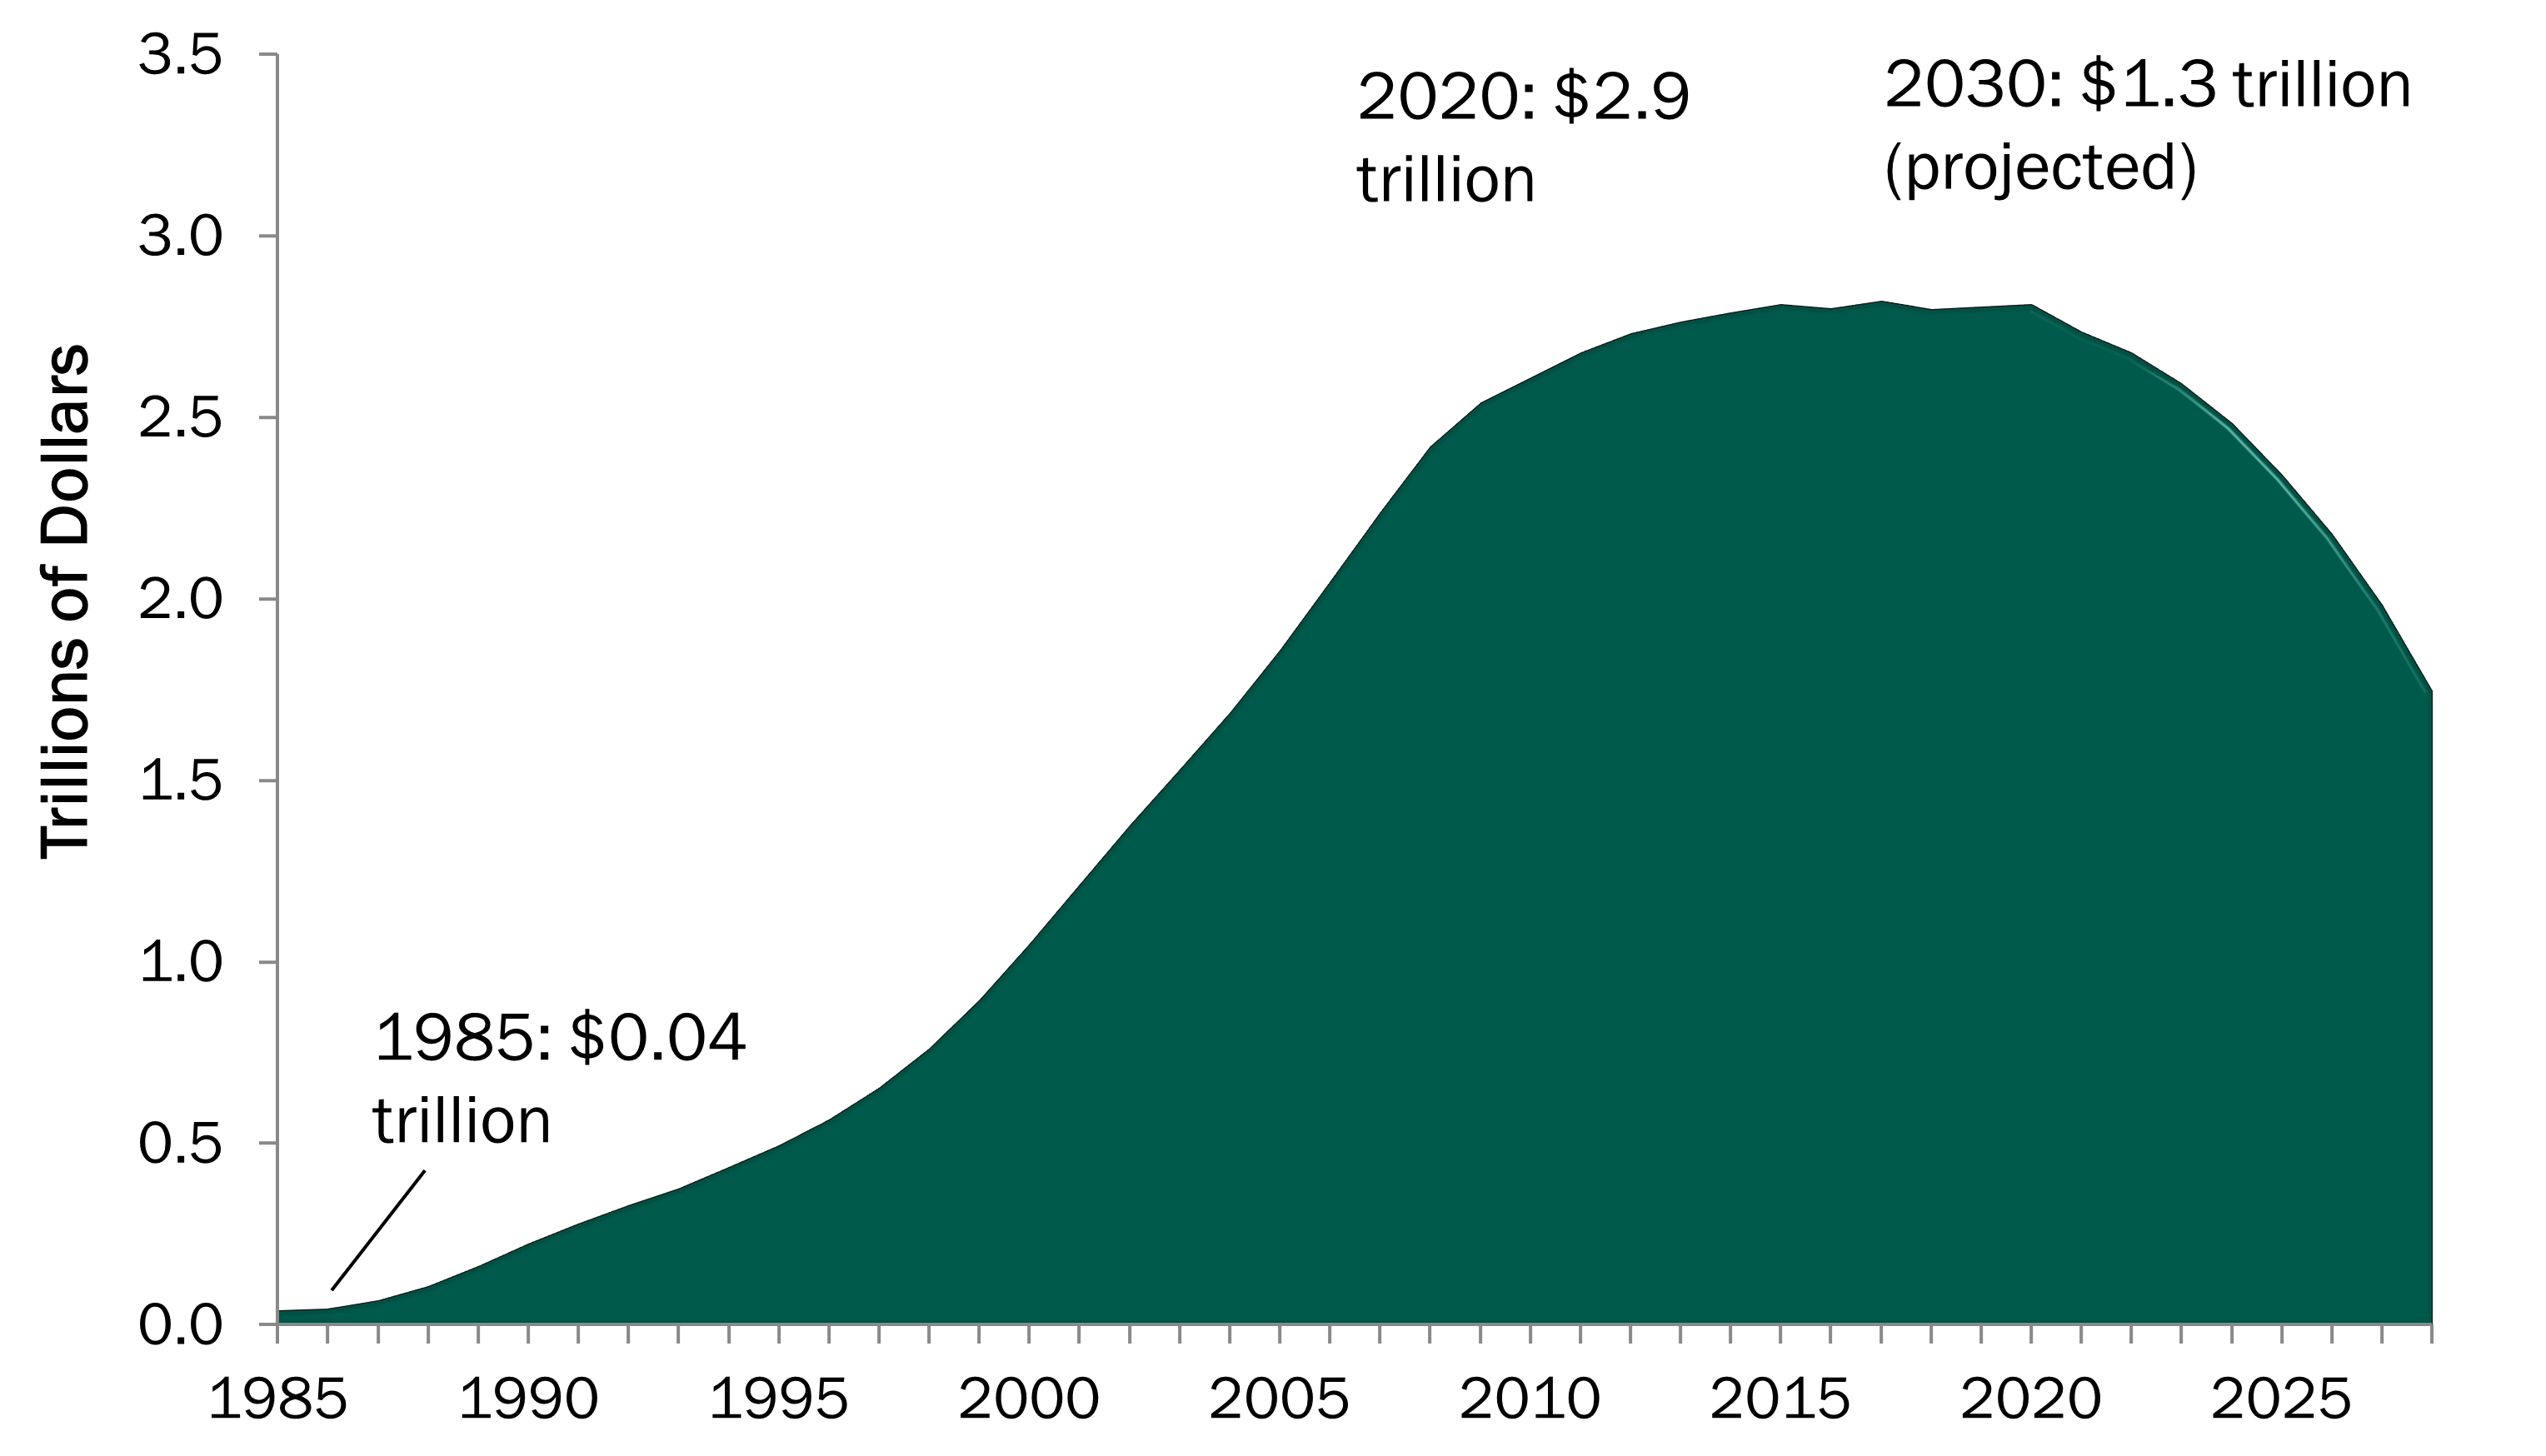
Board of Trustees, 2021: Table IV.A3
Social Security Income and Outgo
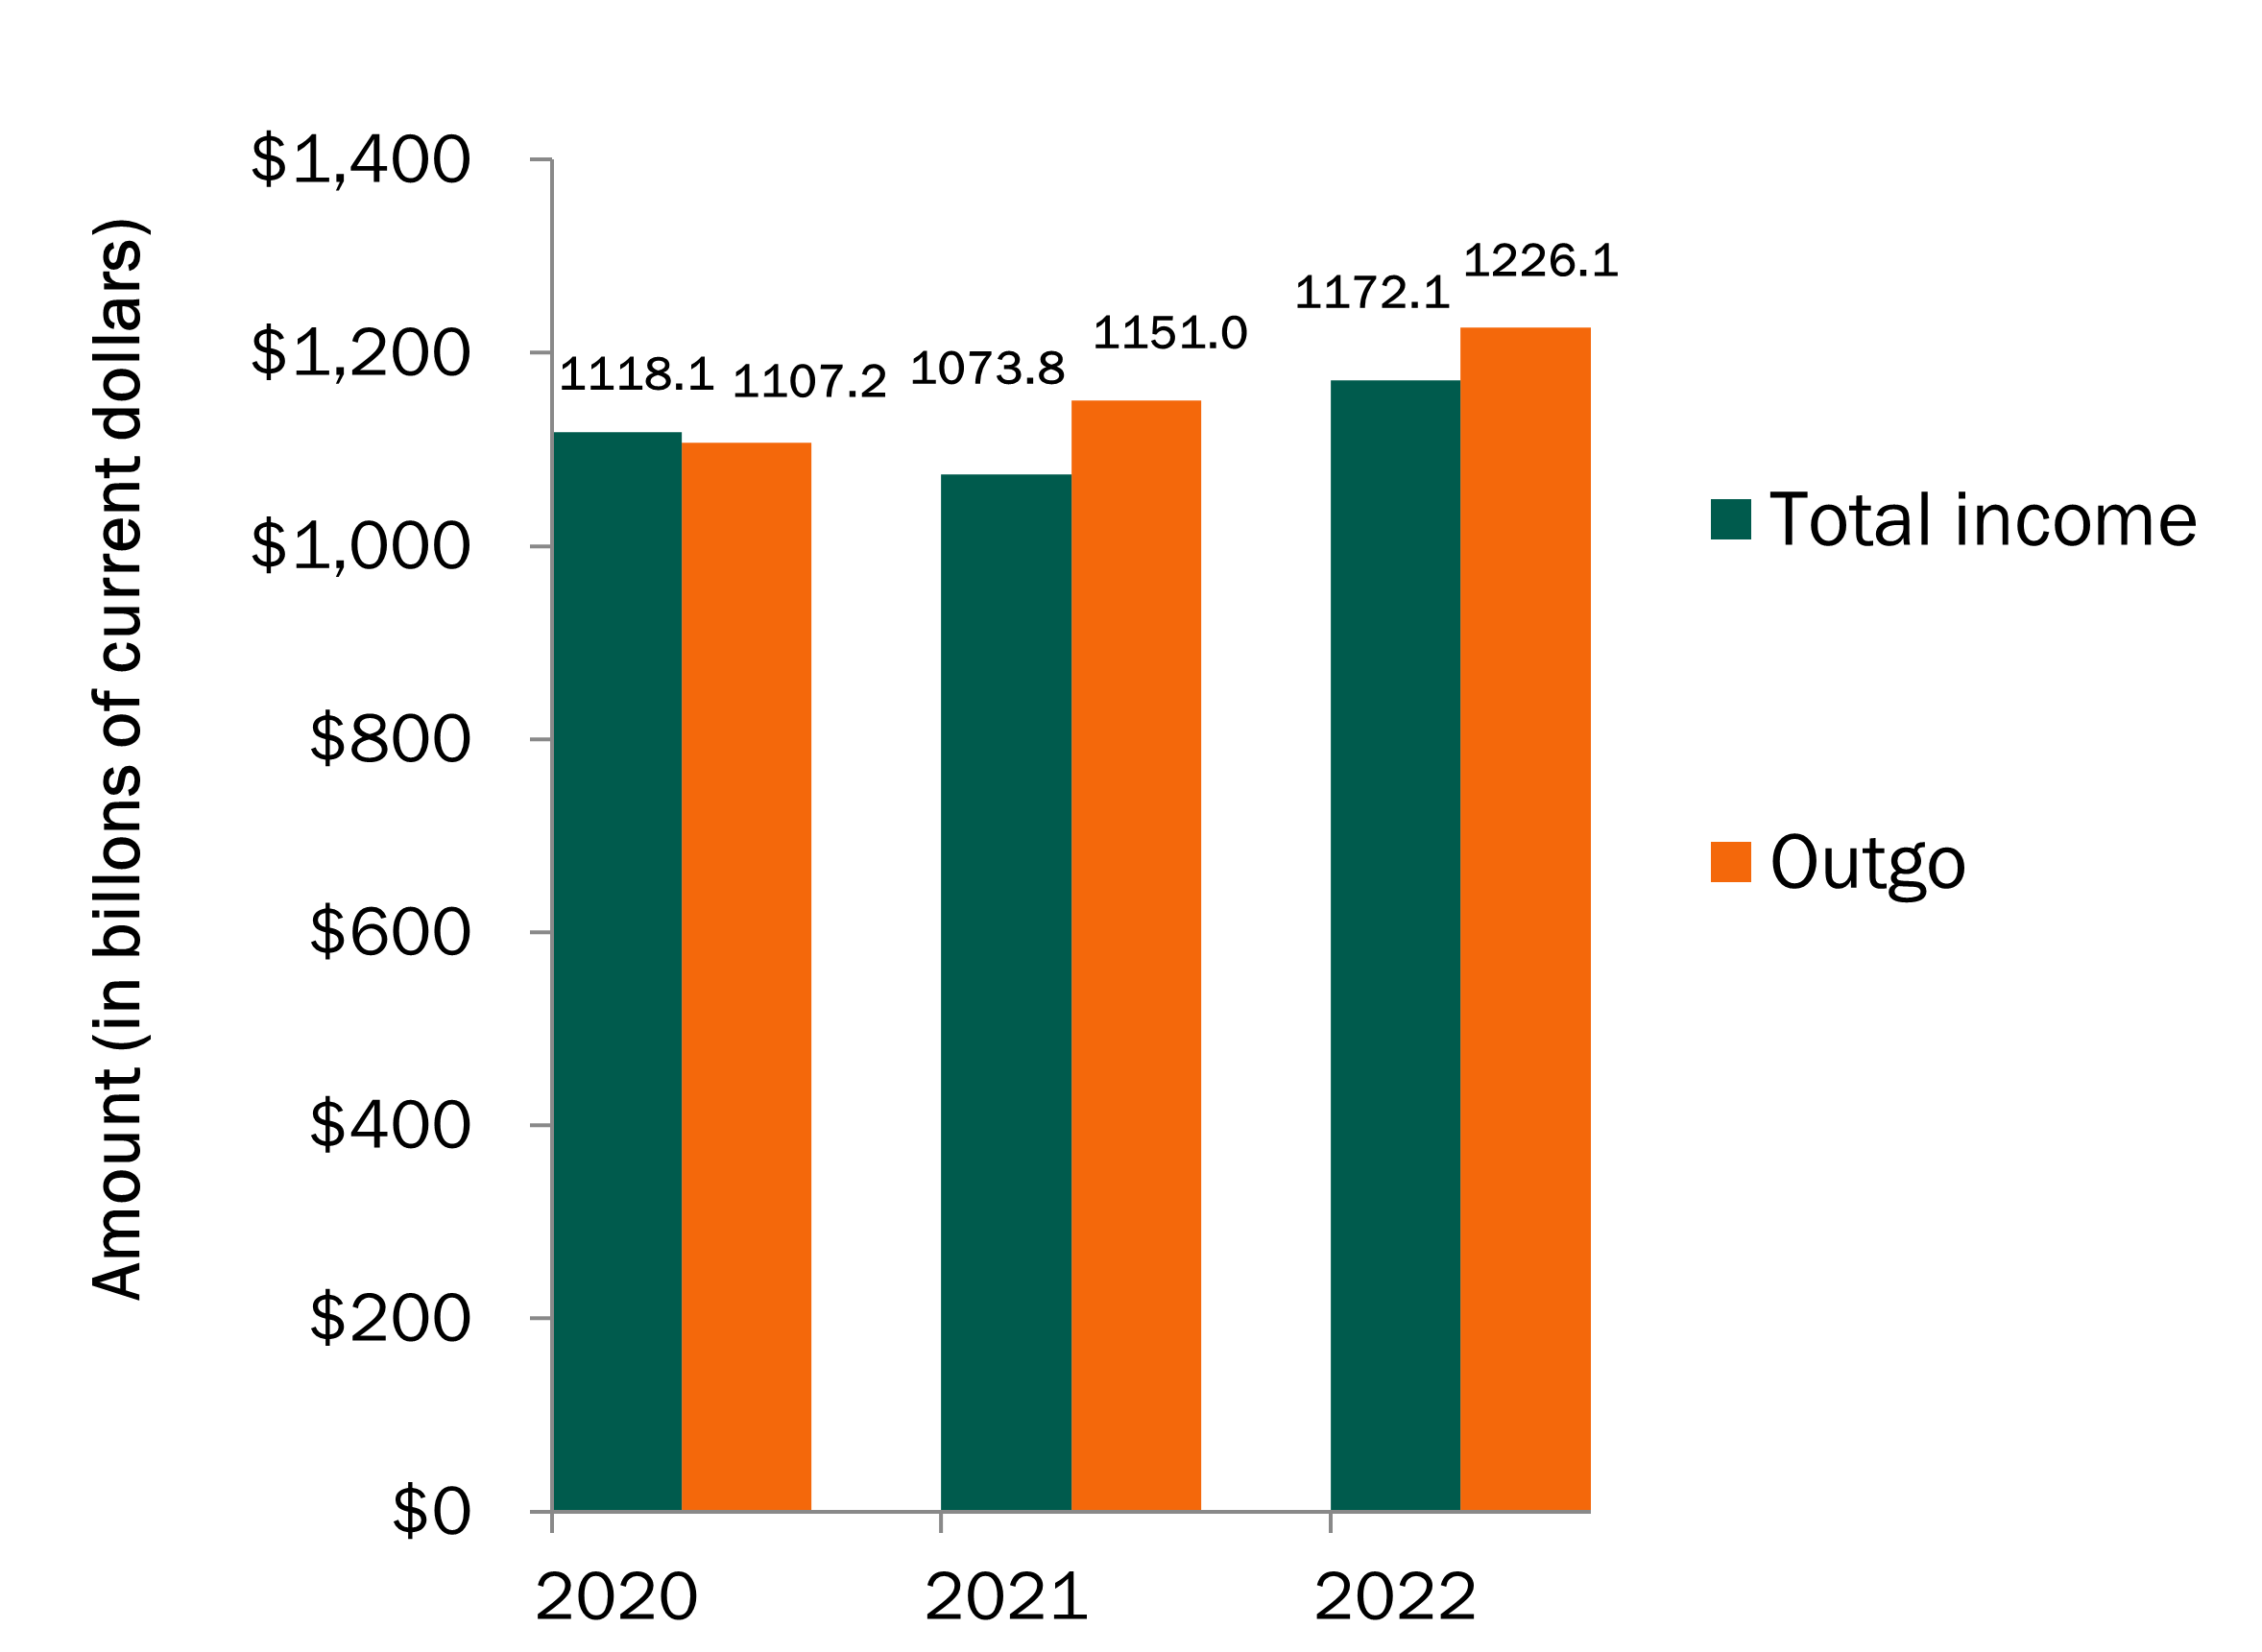
Board of Trustees, 2021: Table IV.A3.
How Do Actuaries Estimate the Future?
- Review the past: birth rates, death rates, immigration, employment, wages, inflation, productivity, interest rates.
- Make assumptions for the next 75 years (longer than the rest of the government).
- Three scenarios:
-
- Low cost;
- High cost;
- Intermediate.
Board of Trustees, 2021: Section V.
The Long-Range Intermediate Projection (Trustees’ Best Estimate)
- In 2021, revenue from payroll contributions, interest on reserves, and taxation of benefits is expected to be less than total outgo for the year. If action is not taken in the near future, reserves will start to be drawn down to pay benefits this year.
- In 2034, Trust Fund reserves are projected to be depleted. Income is projected to cover 78% of benefits due then.
- By 2095, assuming no change in taxes, benefits or assumptions, revenue would cover about 74% of benefits due in that year.
Board of Trustees, 2021: Figure II.D2.
Other Scenarios
Low Cost:
The Trust Fund reserves would not be depleted.
High Cost:
Trust Fund reserves would be depleted in 2031, instead of 2034.
Board of Trustees, 2021: Table IV.B4.
Why Will Social Security Cost More in the Future?
- The share of Americans over age 65 will grow because:
- Boomers are reaching age 65
- People are living longer after age 65
- Birth rates are projected to remain at replacement levels.
- People 65 and older will increase from 17% to 23% of all Americans by 2095.
Board of Trustees, 2021: Table V.A3.
Percent of the Population Receiving Social Security and Percent Age 65+, 2015-2090
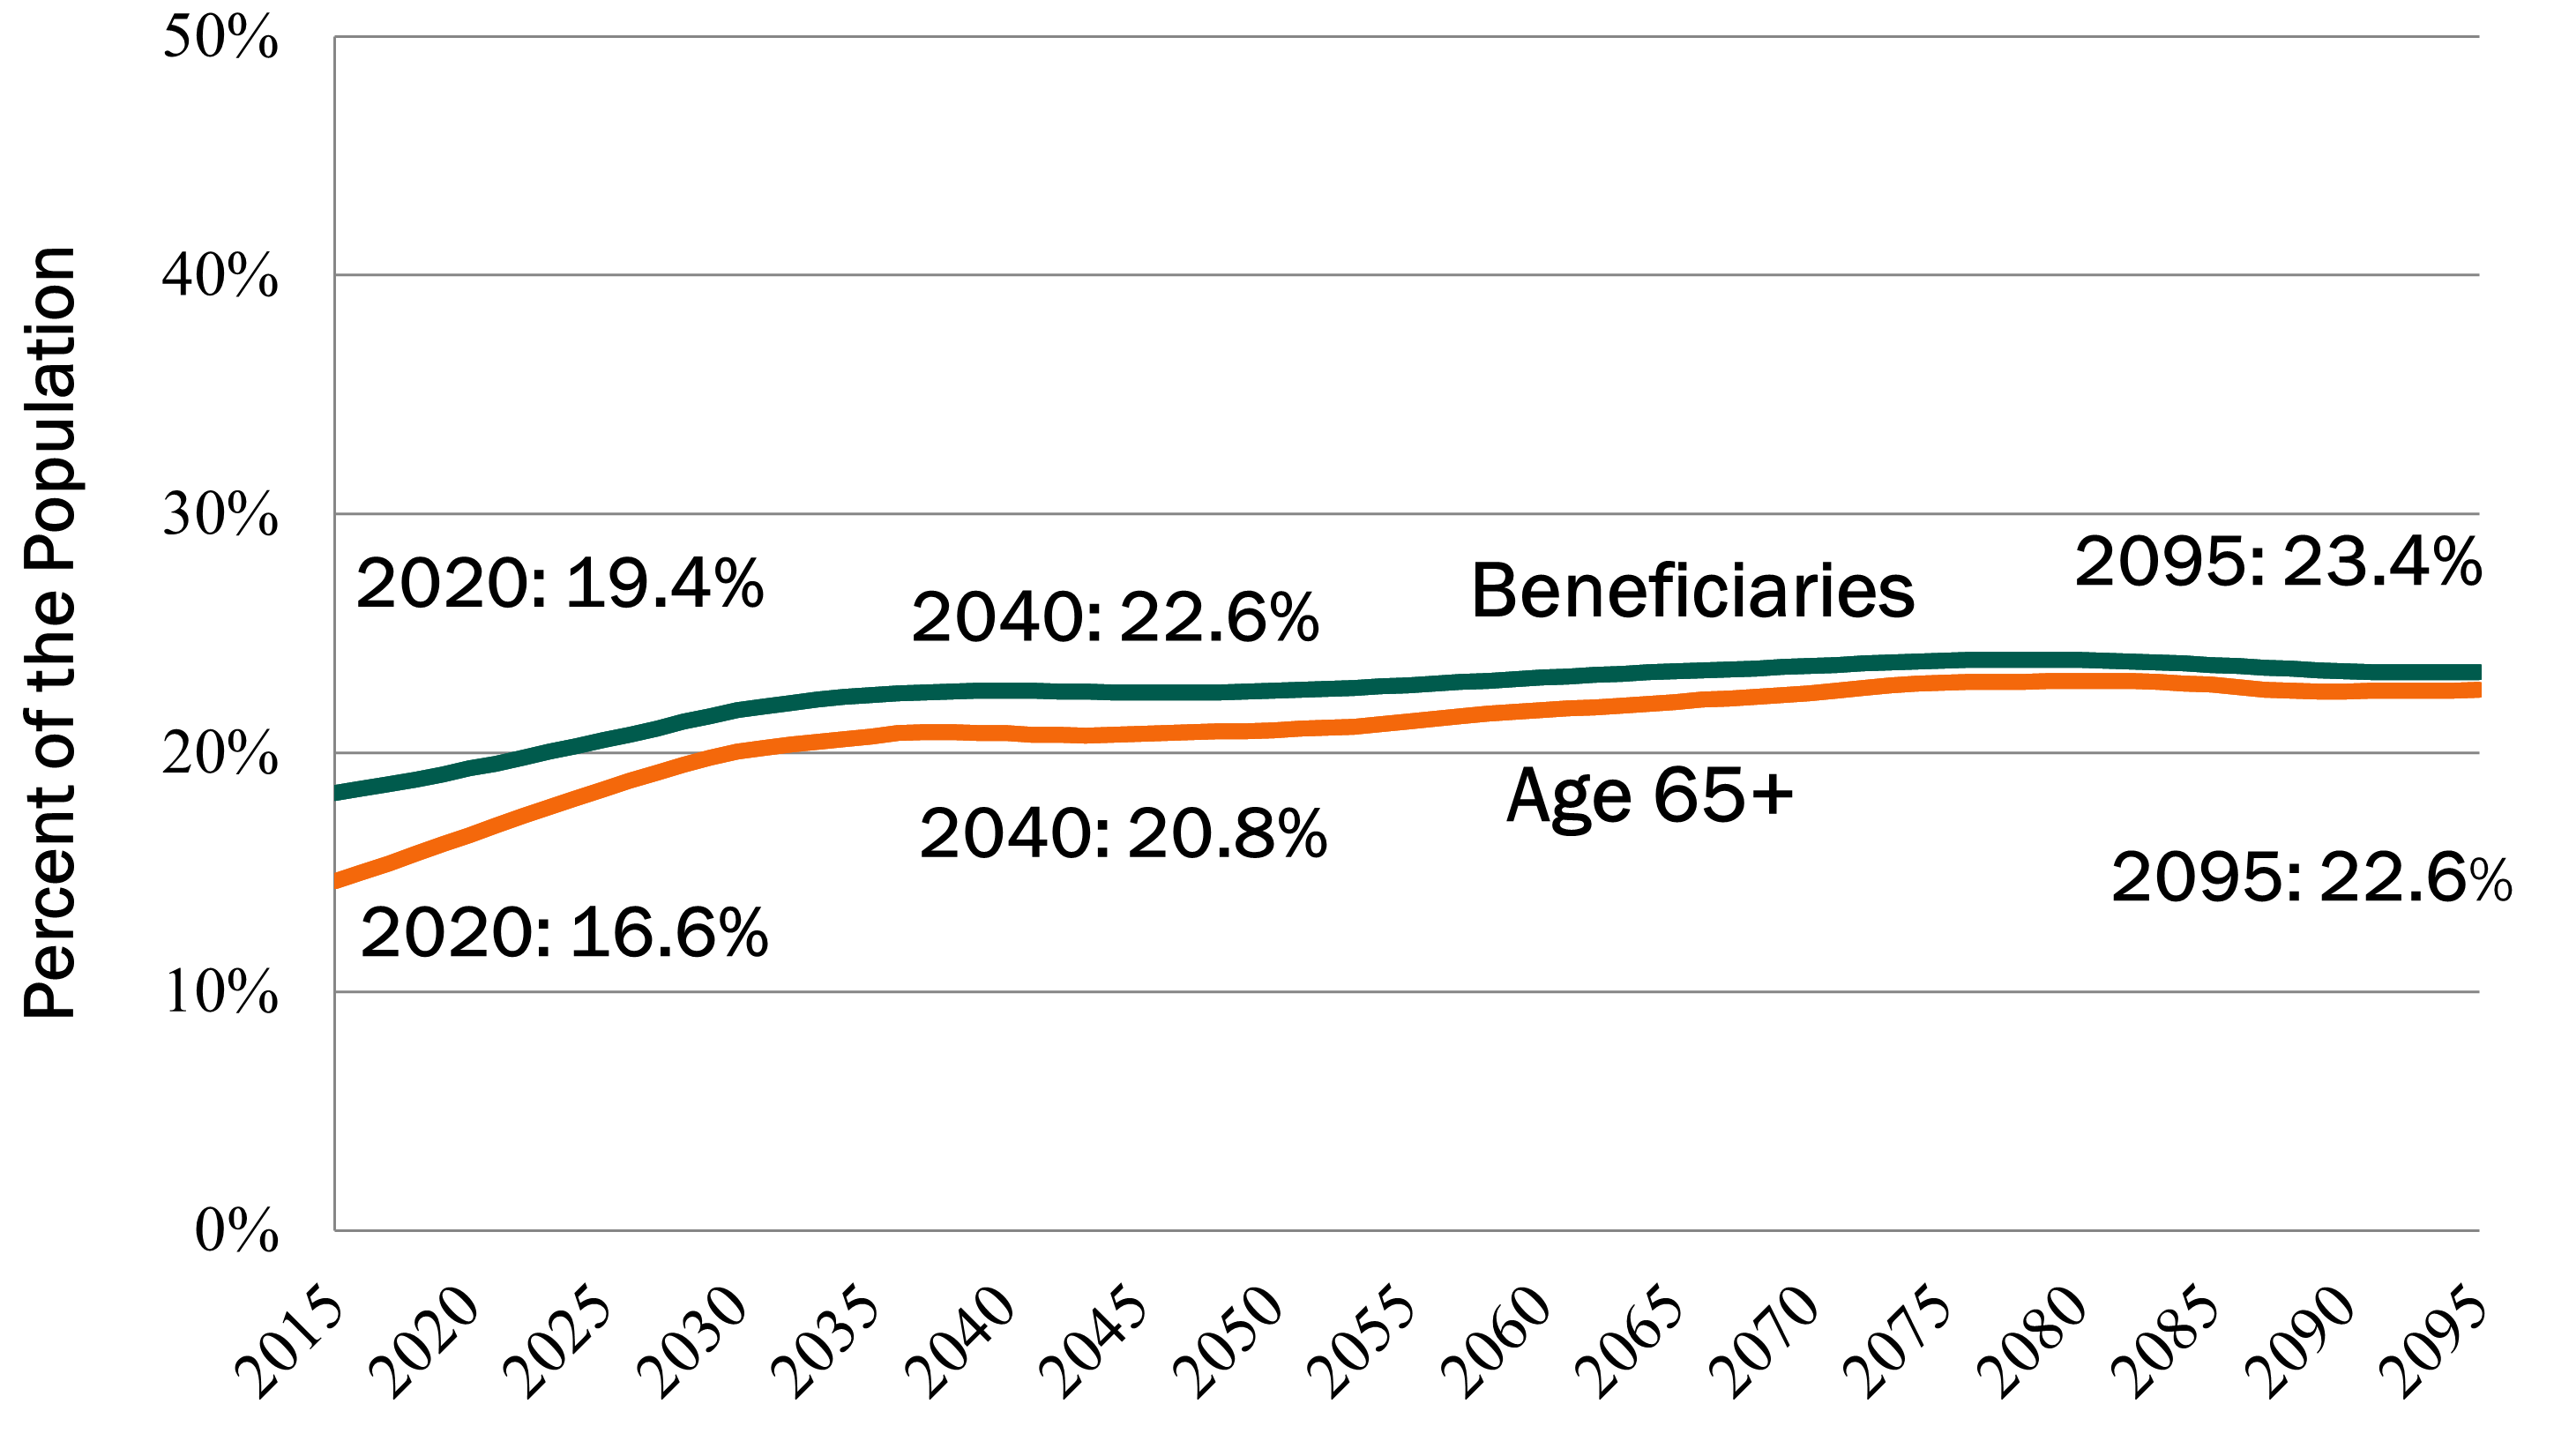
Board of Trustees, 2021: Tables V.A3. and IV.B3.
Can We Afford Social Security in the Future?
Social Security in the Broader Economy
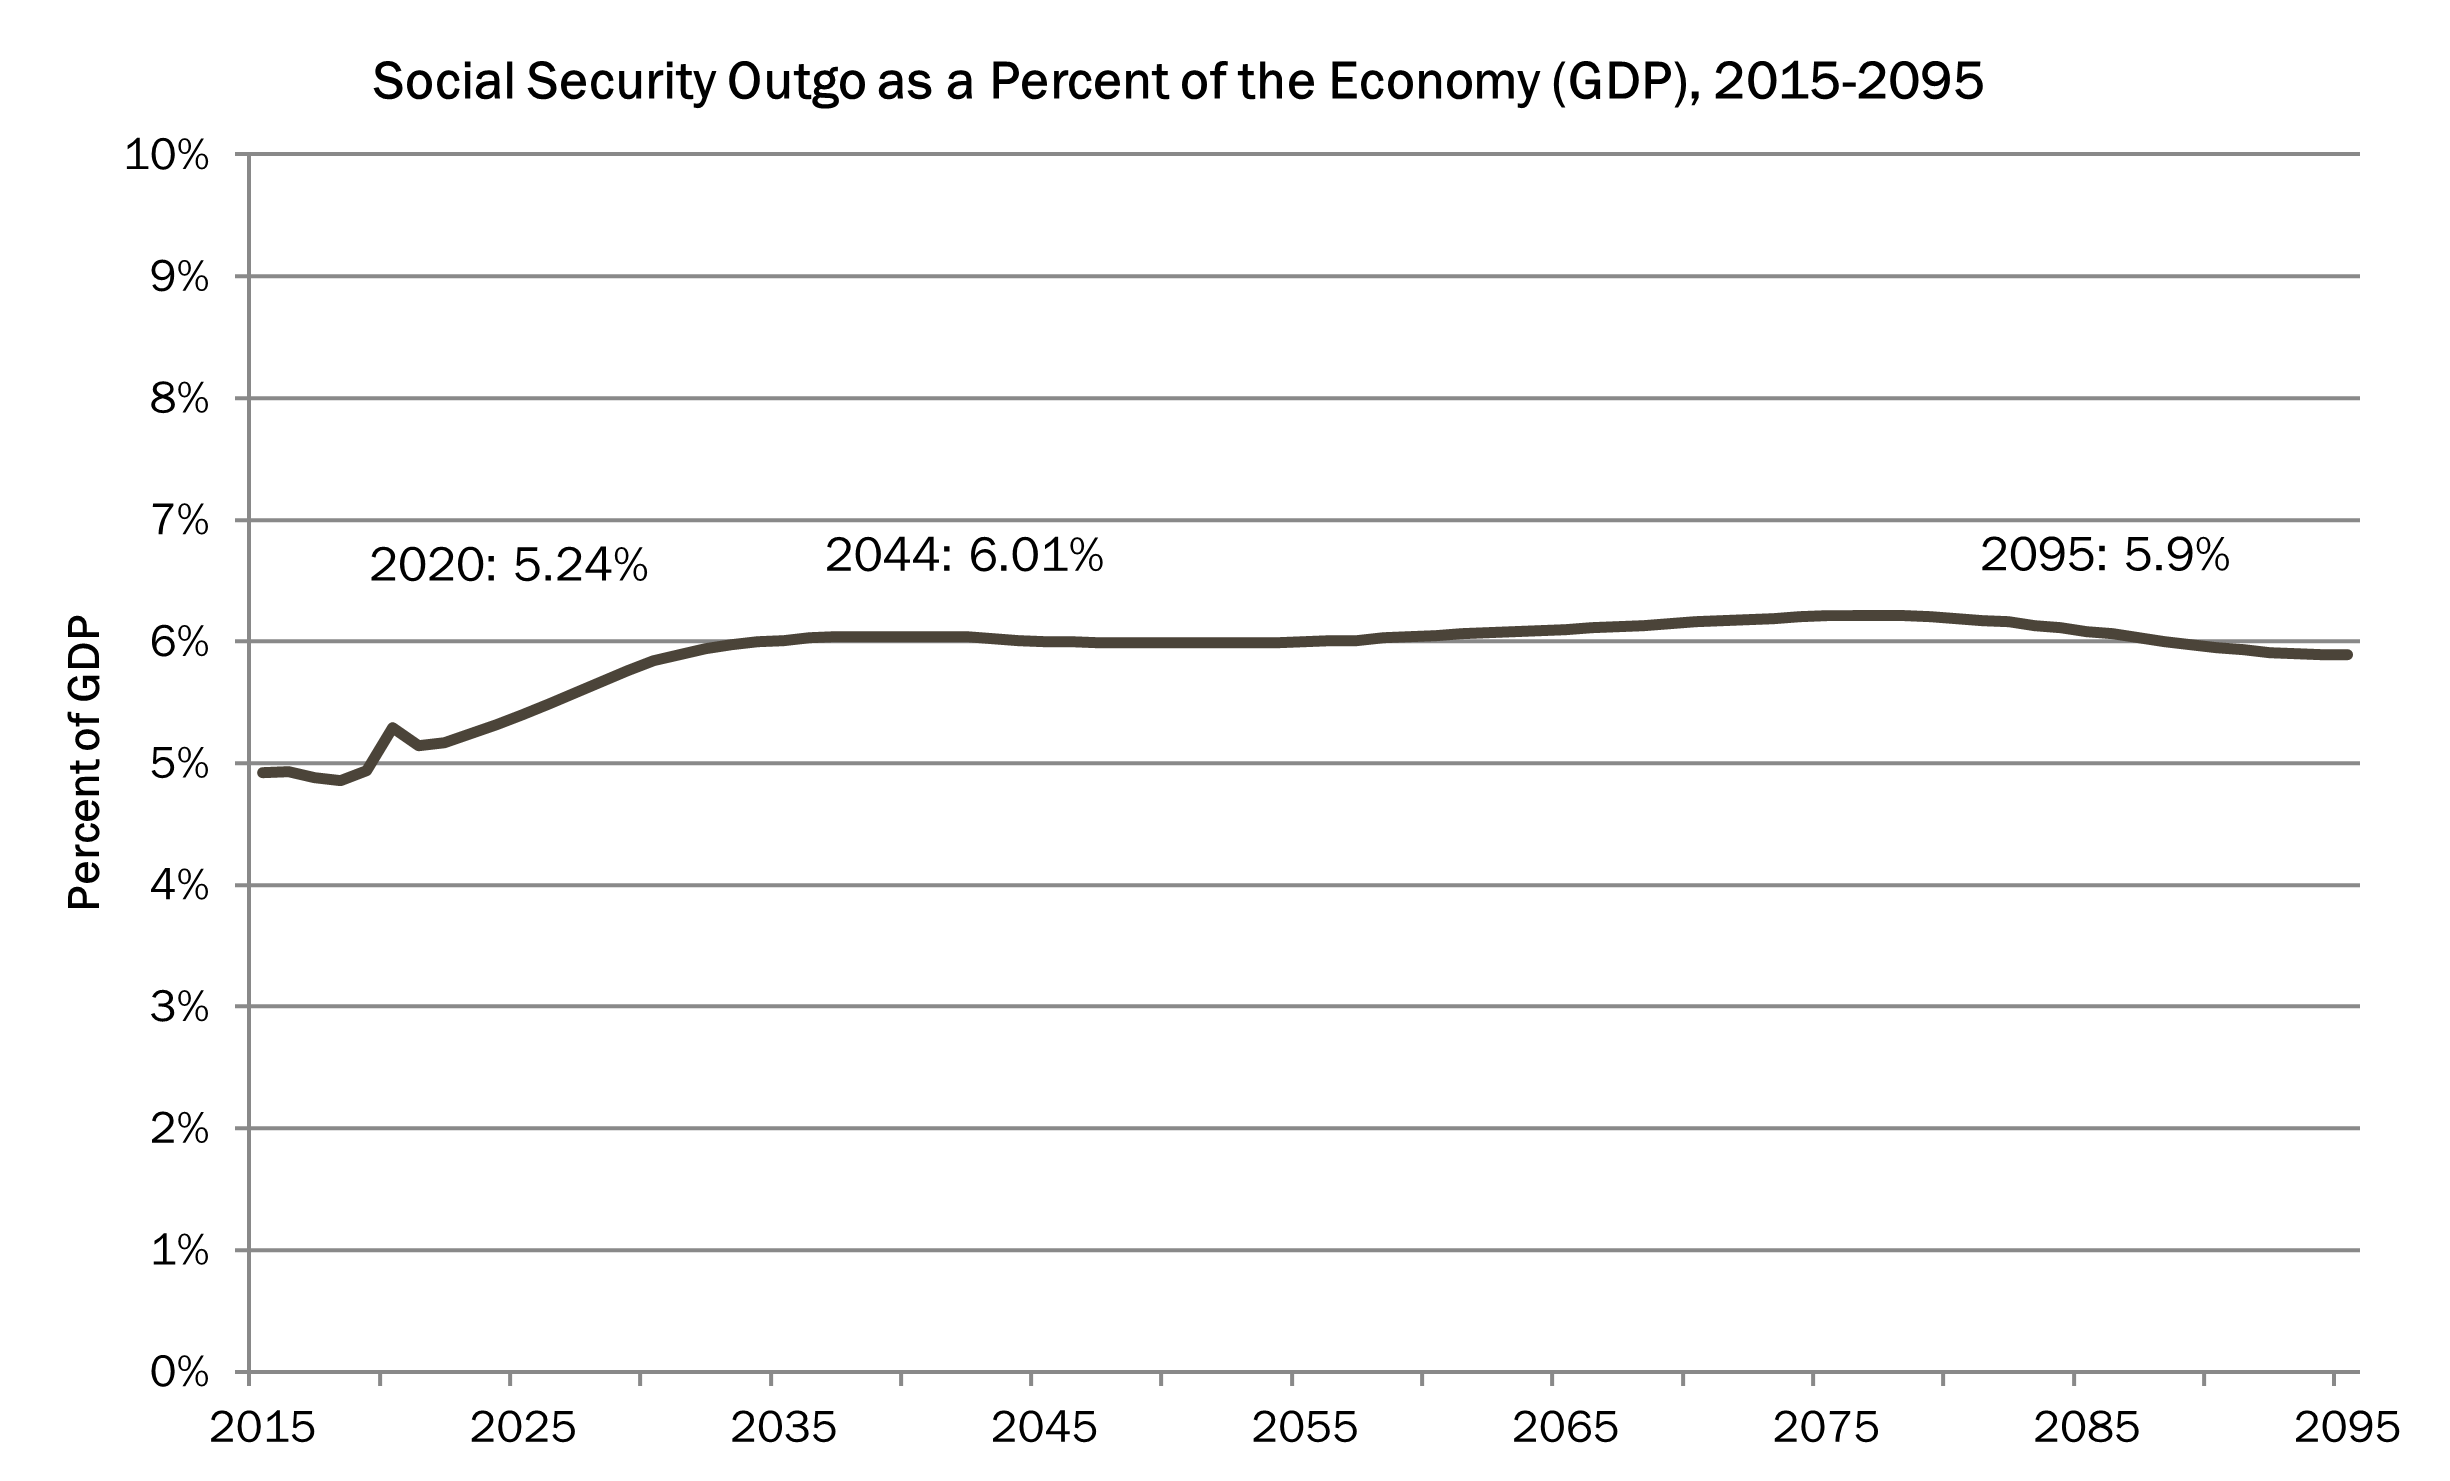
Board of Trustees, 2021: Table VI.G4.
Taxable Payroll in the Broader Economy
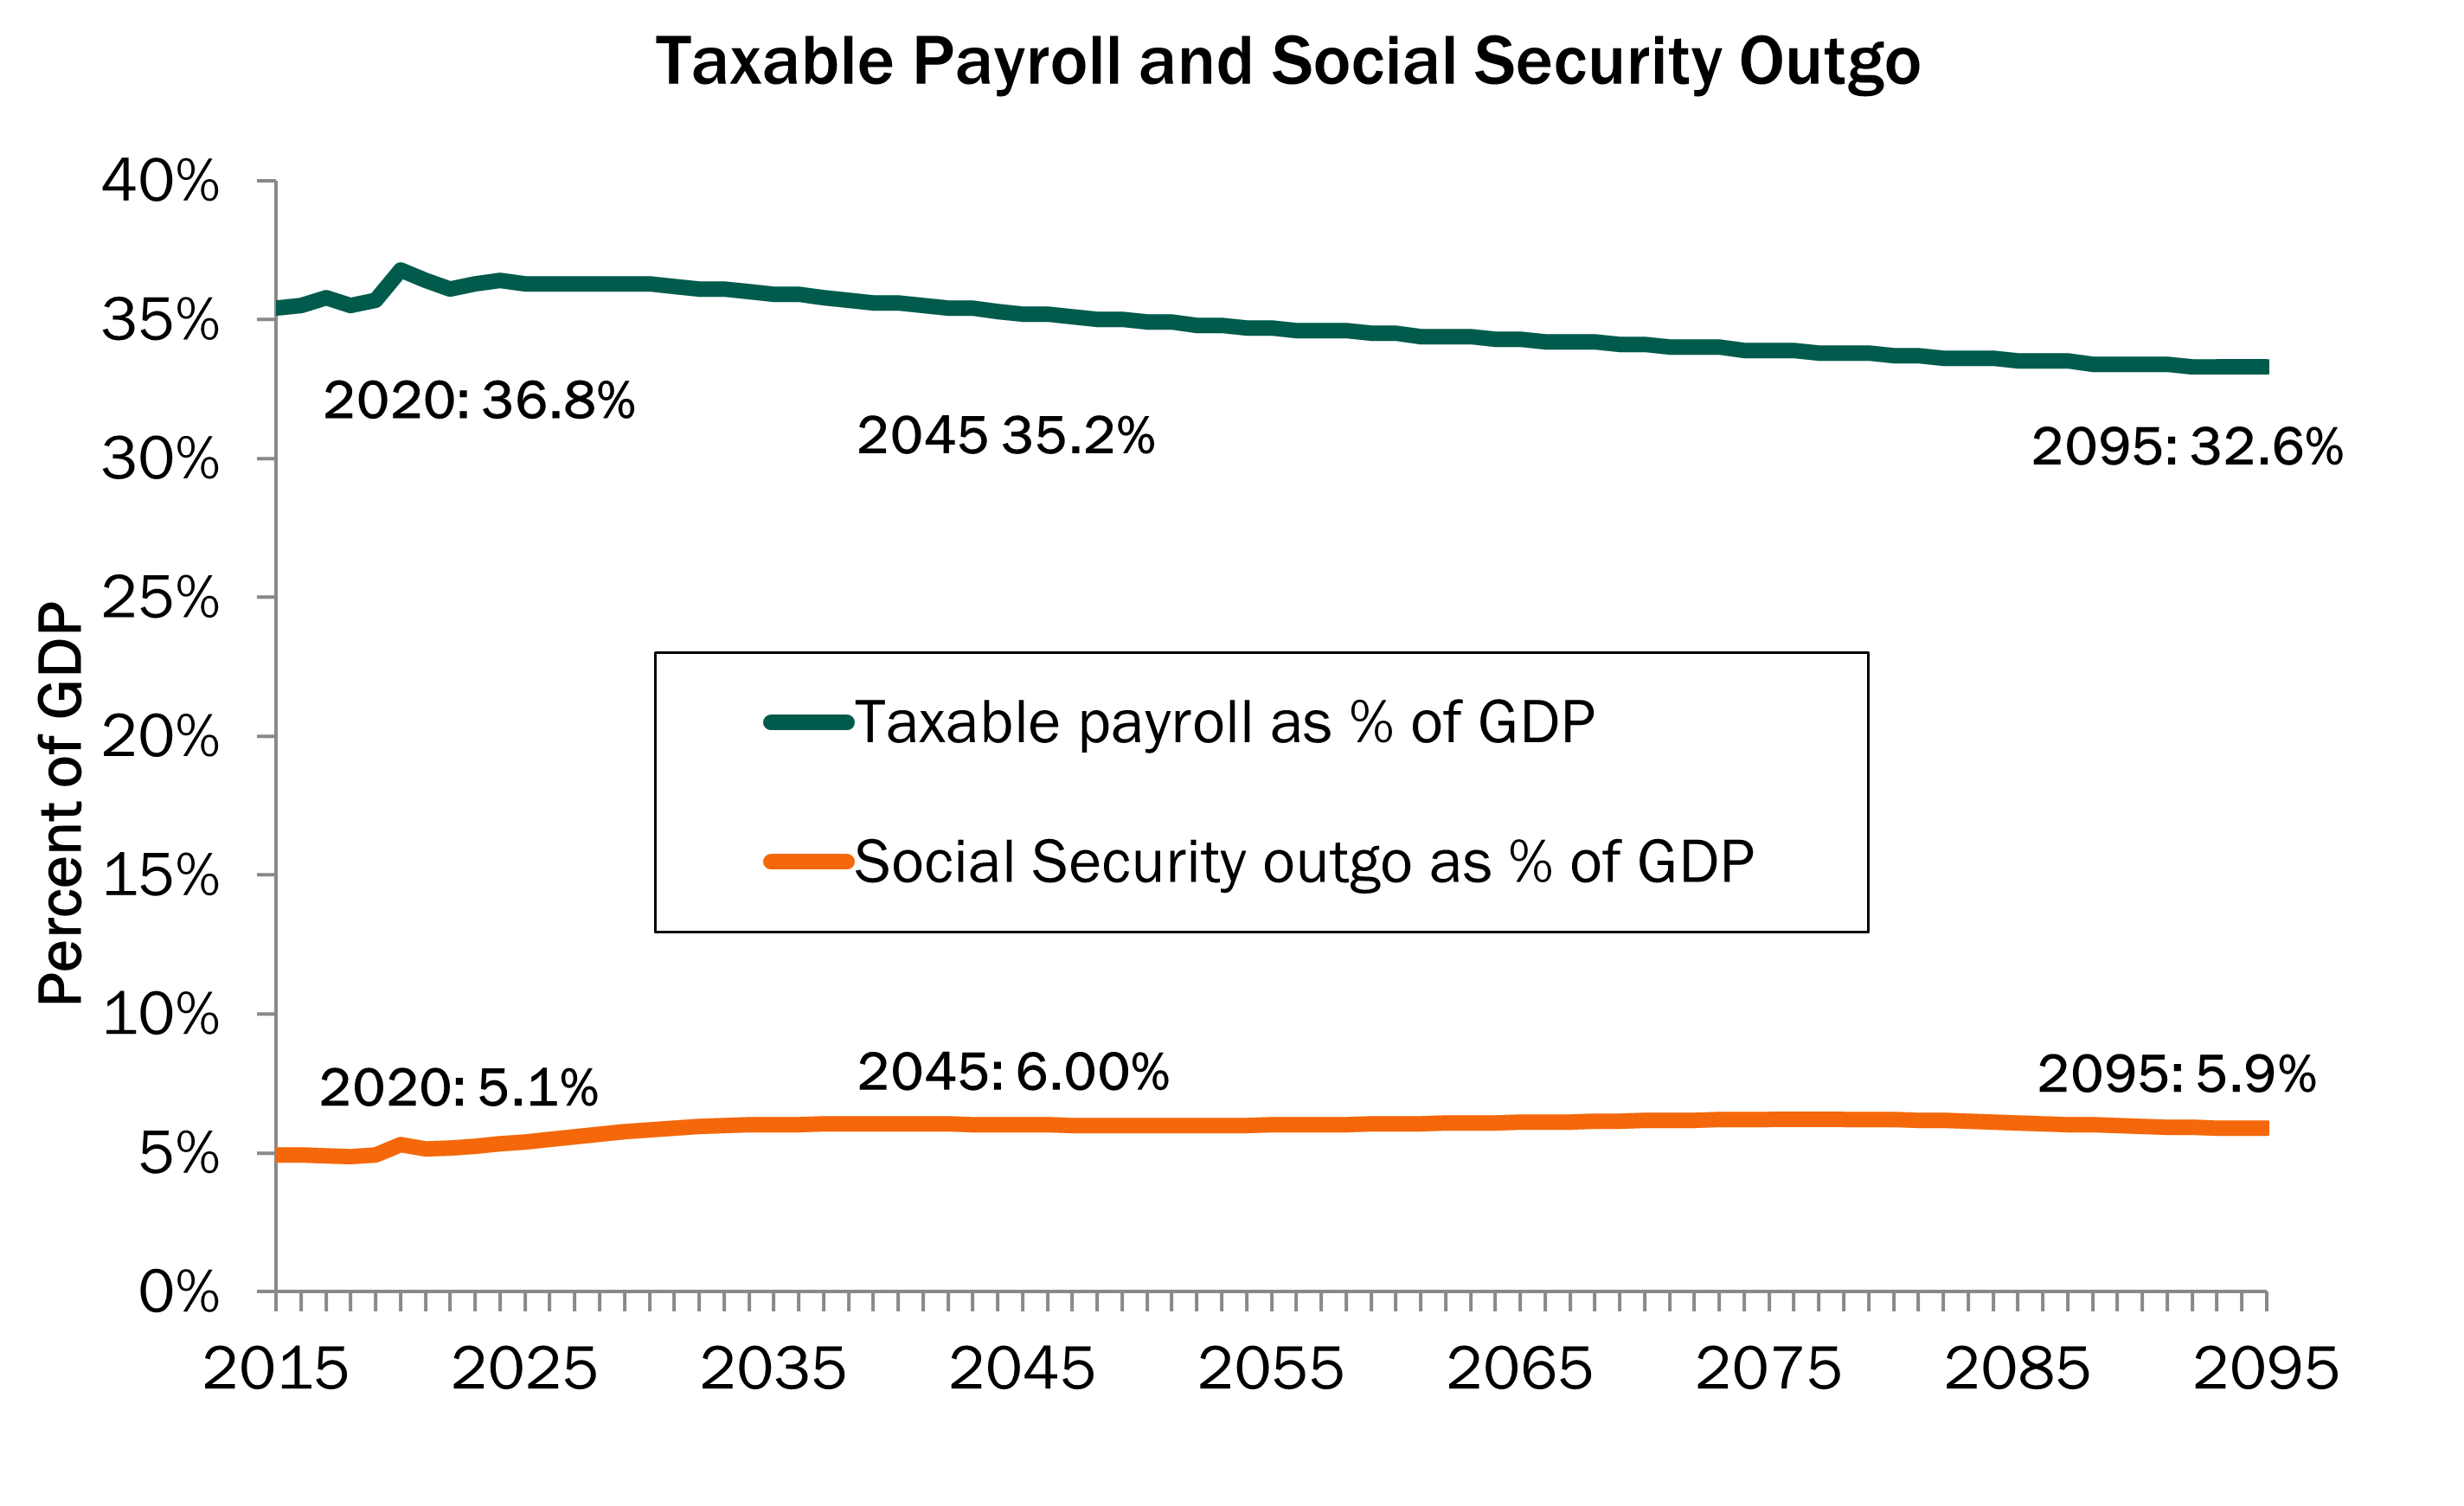
Board of Trustees, 2021: Tables VI.G4 and VI.G5.
Strengthening Social Security
Options to Improve Adequacy
- Options that would improve the adequacy of benefits include:
- Updating the special minimum benefit to ensure that long-serving, low-paid workers can remain out of poverty when they retire.
- Reinstating student benefits until age 22 for children of disabled or deceased workers (currently, benefits for these children stop at age 18-19).
- Allowing up to 5 childcare years to count toward benefits.
- Increasing benefits for widowed spouses in low-earning couples.
- Modestly increasing benefits for all by changing the benefit formula (to increase the first PIA bend point by 15 percent)
Options for Raising Revenues
Options that would help raise revenues include:
- Lifting or eliminating the cap (now $142,800) on the earnings on which workers and their employers pay Social Security contributions.
- Gradually increasing the Social Security contribution rate from its current level of 6.2%.
- Subjecting income from investments to Social Security contributions.
- Treating all salary reduction plans like 401(k)s (subjecting income paid into them to Social Security contributions).
- Restoring estate tax to 2000 level and dedicating to Social Security.
Other Options for Solvency
Some proposals would reduce benefits for some or all beneficiaries in order to extend solvency.
- For example, raising the retirement age amounts to an across-the-board cut in benefits, and hence reduces the program’s cost.
- Switching to the chained CPI as the basis for Social Security’s cost-of-living adjustments (COLAs) would reduce benefits and hence program cost as well.
Reno and Lavery, 2009.
Public Opinion on Social Security
Consistent Findings throughout the Study
- In 2014, the Academy conducted a multigenerational study to understand Americans’ perspectives on Social Security.
- In focus groups, Americans expressed concern about benefits being too low.
- 77% said it is critical to preserve Social Security benefits, even if it means raising taxes on working Americans.
Walker, Reno, and Bethell, 2014.
Consistent Findings throughout the Study
In the trade-off analysis, the package preferred by 71% of respondents would:
- Gradually increase taxes in two ways:
- for high earners by eliminating the taxable earnings cap;
- For all workers by raising the tax rate by 1/20 of 1% per year.
- Increase benefits in two ways:
- For low earners by increasing the special minimum benefit;
- For all beneficiaries by basing COLAs on the inflation experienced by the elderly.
Walker, Reno, and Bethell, 2014.
Majorities of Republicans, Democrats, and Independents Agree
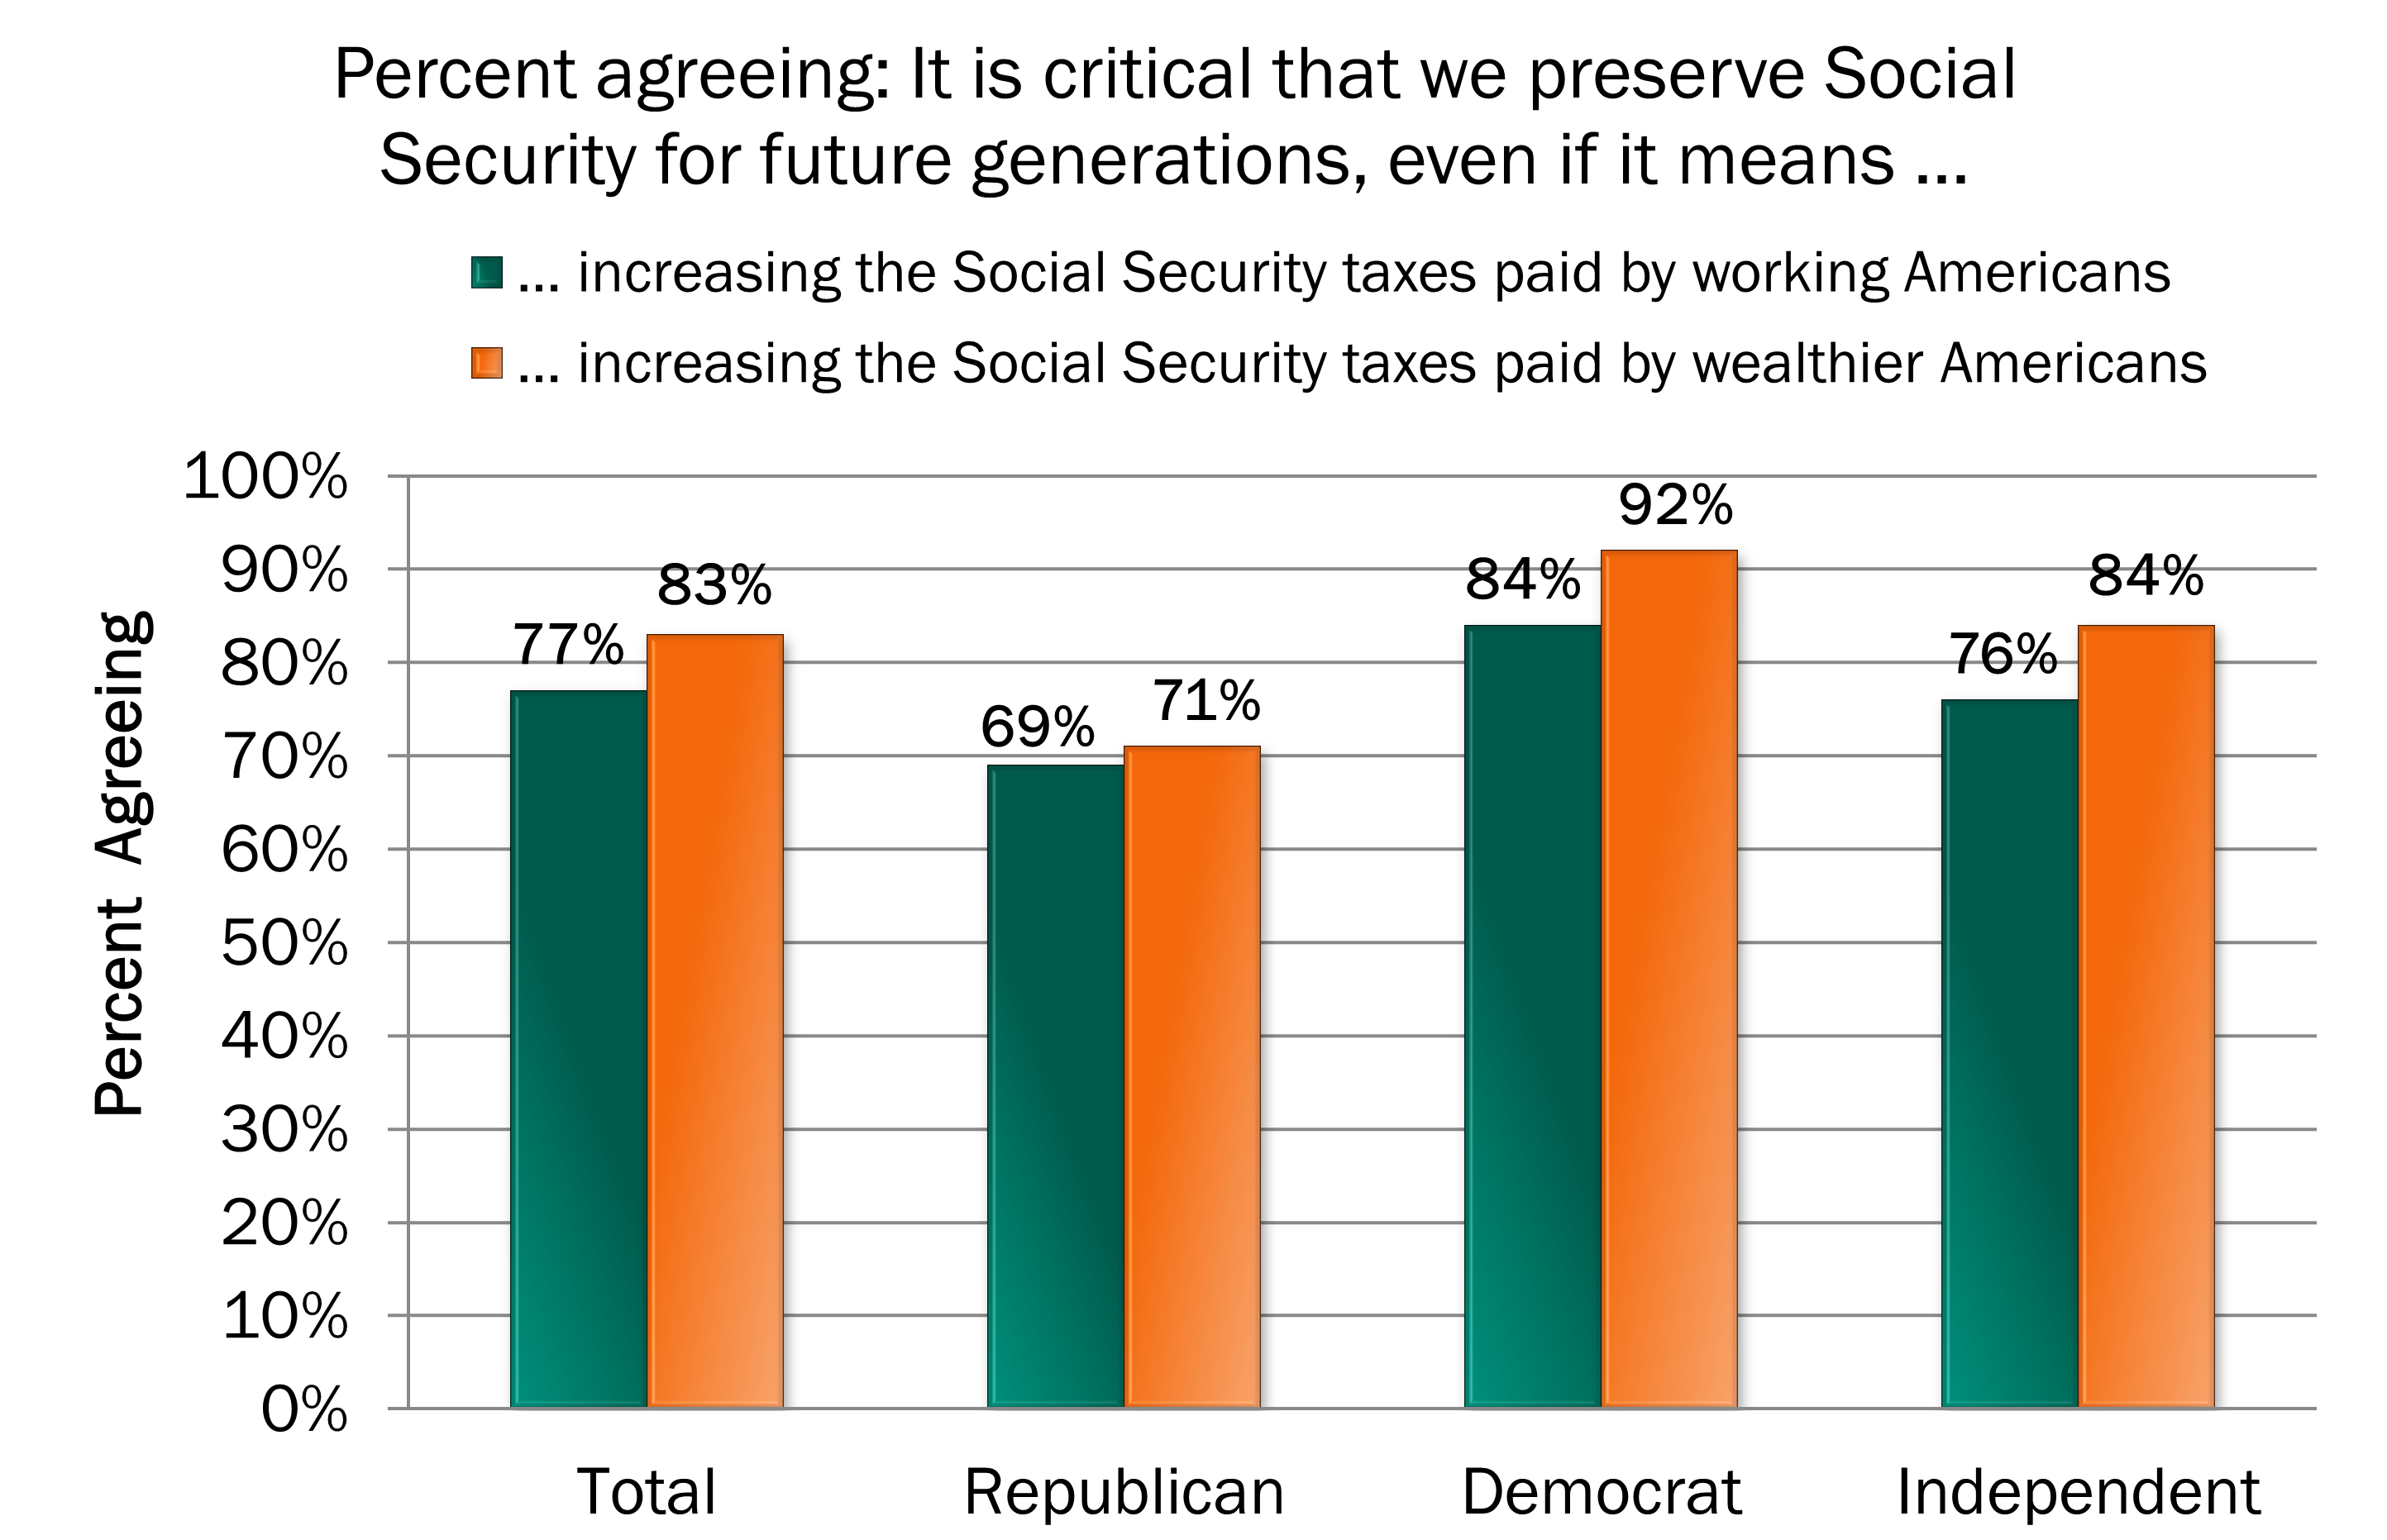
Walker, Reno, and Bethell, 2014.
Demographic Support for Package of Policy Options Preferred by 71% of Americans
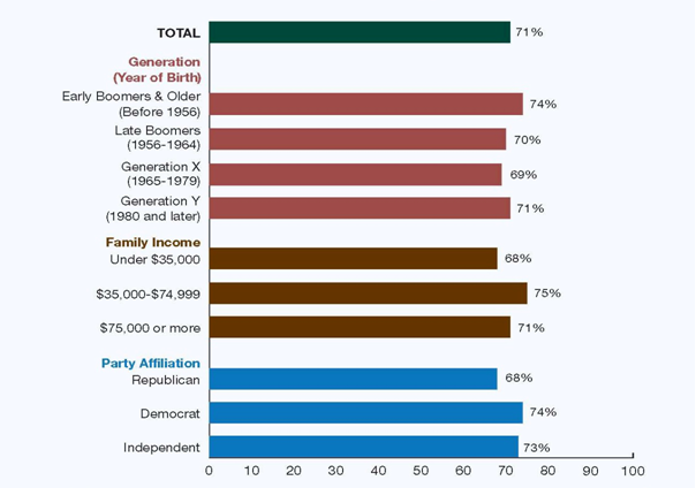
Walker, Reno, and Bethell, 2014.
Recap
- Benefits are modest (dollars and replacement rates). Yet they are most beneficiaries’ main source of income.
- Social Security benefits will replace a smaller share of earnings in the future than they do today (replacement rates are declining because of the increase in the retirement age).
- Revenue increases or benefit cuts will be needed to balance Social Security’s future finances.
- Lawmakers have many options to raise revenues, lower future benefits, or increase benefits to improve adequacy.
- Americans value Social Security and are willing to pay for it.
- Americans report they would rather pay more than see future benefits reduced.
References
- Bailey, Michelle Stegman and Jeffrey Hemmeter. 2015. “Characteristics of Noninstitutionalized DI and SSI Program Participants, 2013 Update.” Research and Statistics Note No. 2015-02. Washington, DC: Social Security Administration. http://www.ssa.gov/policy/docs/rsnotes/rsn2015-02.html
- Bee, Adam and Joshua Mitchell, 2017. “Do Older Americans Have More Income Than We Think?” U.S. Census Bureau Social, Economic, and Housing Statistics Division Working Paper #2017-39, https://www.census.gov/content/dam/Census/library/working-papers/2017/demo/SEHSD-WP2017-39.pdf.
- Board of Trustees. 2021. The 2021 Annual Report of the Board of Trustees of the Federal Old-Age and Survivors Insurance and Federal Disability Insurance Trust Funds. Washington, DC: Social Security Administration.
- Dushi, Irena and Brad Trenkamp, 2021. “Improving the Measurement of Retirement Income in the Aged Population”. Washington, DC: Social Security Administration, Office of Research, Evaluation, and Statistics. ORES Working Paper No. 116. https://www.ssa.gov/policy/docs/workingpapers/wp116.html
- Gregory, Janice M., Thomas N. Bethell, Virginia P. Reno, and Benjamin W. Veghte. 2010. “Strengthening Social Security for the Long Run.” Social Security Brief No. 35. Washington, DC: National Academy of Social Insurance.
- Munnell, Alicia H. 2013. “Social Security’s Real Retirement Age is 70.” Brief No. 13-15. Chesnut Hill, MA: Center for Retirement Research at Boston College.
- National Academy of Social Insurance. 2020. “Social Security Finances: Findings of the 2020 Trustees Report.” Washington, DC: National Academy of Social Insurance. https://www.nasi.org/research/social-security/social-security-finances-findings-of-the-2020-trustees-report-2/
- Reno, Virginia P. and Joni Lavery. 2009. Fixing Social Security: Adequate Benefits, Adequate Financing. Washington, DC: National Academy of Social Insurance.
- Reno, Virginia P., Elisa A. Walker, and Thomas N. Bethell. 2013. “Social Security Disability Insurance: Action Needed to Address Finances.” Social Security Brief No. 41. Washington, DC: National Academy of Social Insurance.
- Social Security Administration. 2021a. “Beneficiary Data: Number of Social Security beneficiaries at the end of July of 2021.” Baltimore, MD: Social Security Administration, Office of the Chief Actuary. https://www.ssa.gov/OACT/ProgData/icp.html
- Social Security Administration. 2021b. “Beneficiary Data: Benefits Paid by Type of Family.” Data for December of 2020. Baltimore, MD: Social Security Administration, Office of the Chief Actuary. www.ssa.gov/OACT/ProgData/famben.html
- Social Security Administration. 2021c. “Replacement Rates For Hypothetical Retired Workers.” Actuarial Note #2021.9. Baltimore, MD: Social Security Administration, Office of the Chief Actuary. https://www.ssa.gov/OACT/NOTES/ran9/index.html
- Social Security Administration. 2021d. “Fact Sheet: Social Security”. Data for December 2020. Baltimore, MD: Social Security Administration, Office of the Chief Actuary. https://www.ssa.gov/news/press/factsheets/basicfact-alt.pdf
- Social Security Administration. 2020. Annual Statistical Report on the Social Security Disability Insurance Program, 2019. Washington, DC: Social Security Administration, Office of Research, Evaluation, and Statistics. https://www.ssa.gov/policy/docs/statcomps/di_asr/index.html
- Social Security Administration. 2016. Income of the Population 55 or Older, 2014. Washington, DC: Social Security Administration, Office of Research, Evaluation, and Statistics.
- Walker, Elisa A., Virginia P. Reno, and Thomas N. Bethell. 2014. Americans Make Hard Choices on Social Security: A Survey with Trade-Off Analysis. Washington, DC: National Academy of Social Insurance.
dddddddddddddddddd